The probe MU1210 is available from Cayman Chemical and Sigma.
The negative control MU140 is available from Sigma.
| Probe | Negative control | |
 |
|  |
MU1210 |
| MU140 |
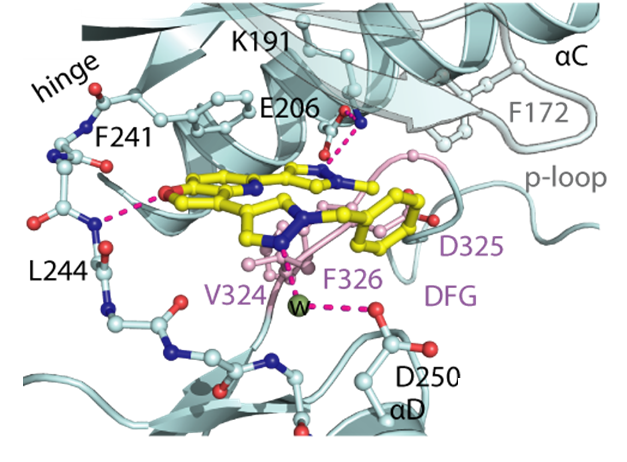
The Cdc2-like kinases (CLK) are evolutionary highly conserved dual specificity protein kinases. The CLK family consists of four members; CLK1, 2, 3, and 4 (Figure 1) (1). CLKs have a highly conserved domain structure at the C-terminus, containing a signature amino acid motif EHLAMMERILG (termed ‘LAMMER kinases’) (2). CLKs auto-phosphorylate on serine/threonine and tyrosine residues and phosphorylate exogenous substrates on serine/threonine residues (3). They play an important role in the regulation of RNA splicing through phosphorylation of members of the serine and arginine-rich family of splicing factors (SRSF). Phosphorylation of SRSF proteins on numerous serine residues is a prerequisite for entry of SRSF proteins into the nucleus, and for the assembly of the spliceosome (4). Being part of the splicing machinery, CLKs are often associated with the development of many pathologies, including cancer and neurodegenerative disorders. However, to date CLK-dependent RNA processing events remains poorly defined. Therefore, a chemical probe for CLK1/2/4, MU1210, and a negative control compound, MU140, have been developed in collaboration with the laboratory of Kamil Paruch at Masaryk University, Brno (5).
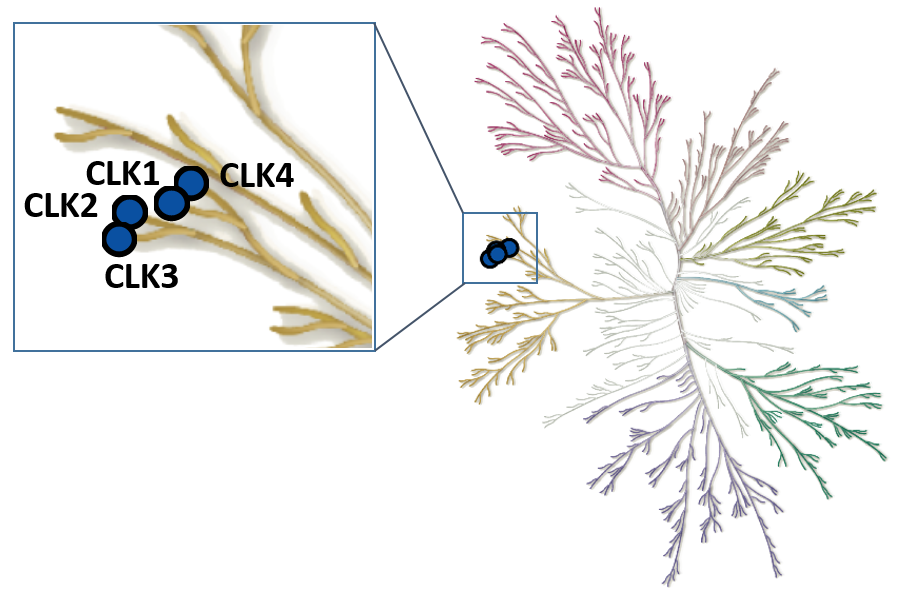
Figure 1: Phylogenetic kinase tree, CLK family highlighted with blue circles. Illustration is reproduced courtesy of Cell Signaling Technology, Inc. (www.cellsignal.com).
Potency Against Target Family
MU1210 is a potent probe for CLK1/2/4 with IC50 values of 8/20/12 nM, respectively with corresponding good cellular potency in NanoBRET assays (84/91/23 nM), respectively. CLK3 was not inhibited by MU1210 at concentrations up to 3 µM.
Selectivity
MU1210 is selective in a panel of 210 kinases in an activity-based assay (Invitrogen) at 1 µM. The closest off-target is HIPK2 (IC50 of 23 nM; >5x), however this was not inhibited in the cellular NanoBRET assays at 10 µM.
Dosage
Due to the relatively low solubility of the compound, concentrations higher than 10 µM should be avoided. It is recommended to use MU1210 at 1 µM and to make use of the additional CLK chemical probes T3-CLK and UNC-CAF-170 in the experiment.
Cellular Activity
In NanoBRET assays, MU1210 shows also a potency of 1.7 µM against the splicing kinase DYRK2. Western blots analyses showed that MU1210 inhibits the phosphorylation of SRSF proteins in a dose-depended manner and induces alternative splicing of Mdm4 at 10 µM in HeLa cells.
| Probe |
|
MU1210 |
| Physical and chemical properties for MU1210 | |
| Molecular weight | 352.39 |
| Molecular formula | C22H16N4O |
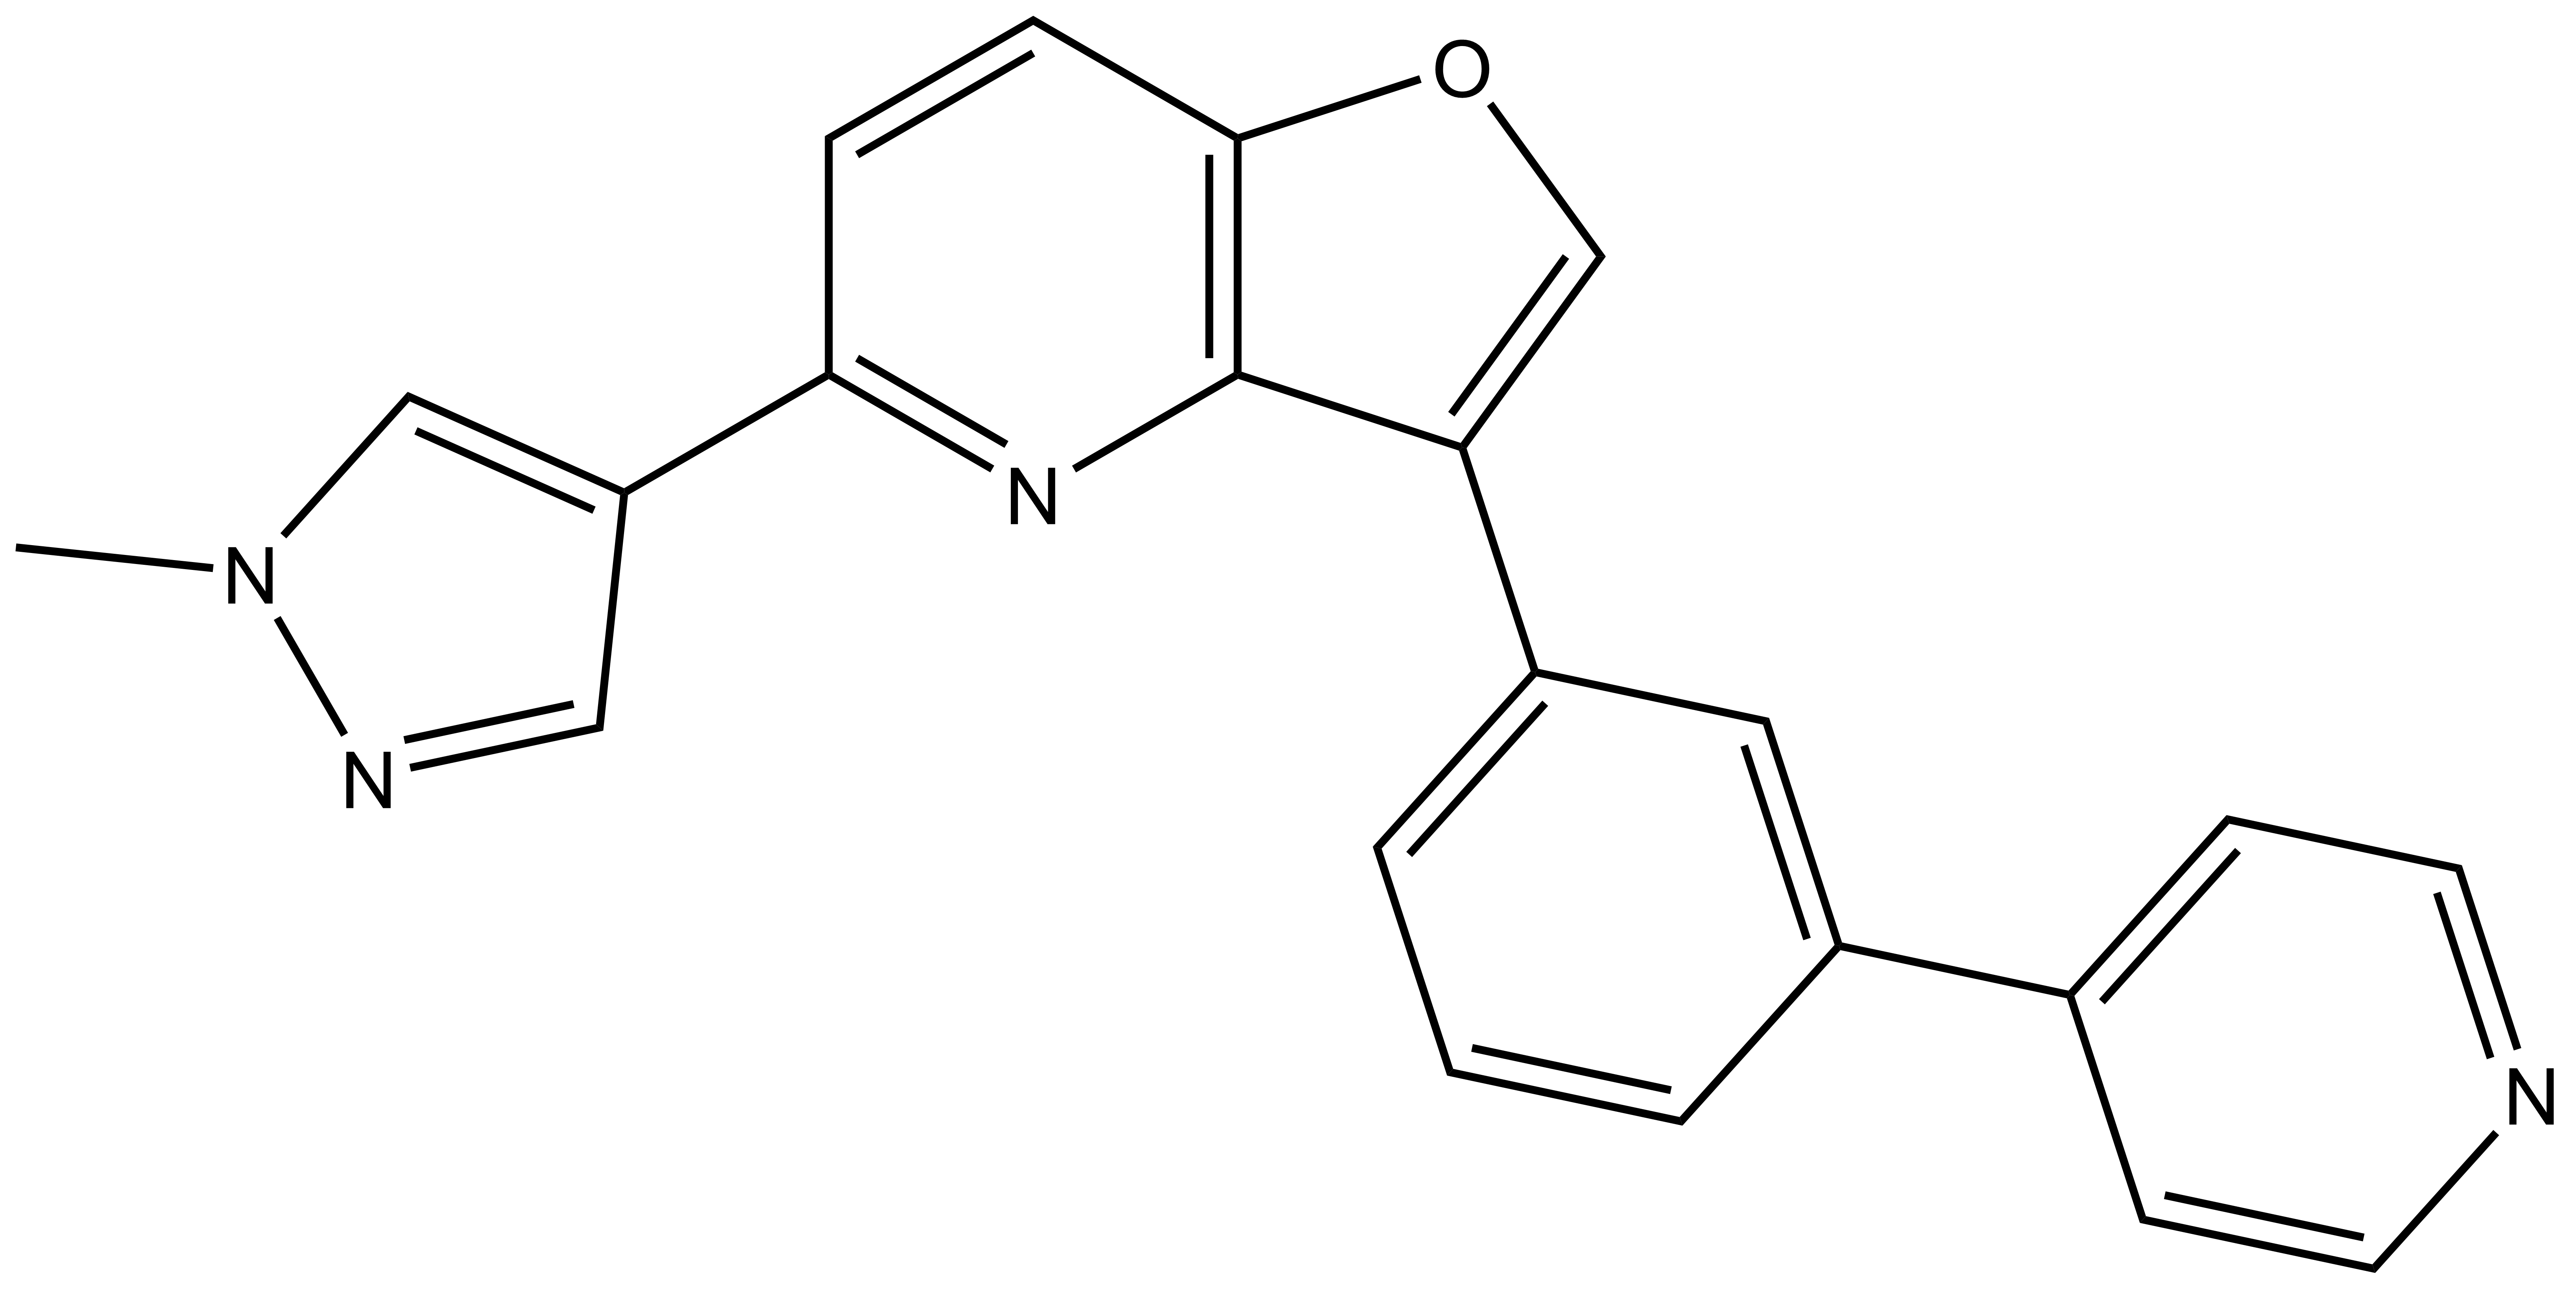
| IUPAC name | 5-(1-methylpyrazol-4-yl)-3-[3-(4-pyridyl)phenyl]furo[3,2-b]pyridine |
| MollogP | 3.89 |
| PSA | 56.74 |
| No. of chiral centres | 0 |
| No. of rotatable bonds | 3 |
| No. of hydrogen bond acceptors | 3 |
| No. of hydrogen bond donors | 0 |
| Storage | Stable as a solid in the dark at -20°C. NB making aliquots rather than freeze-thawing is recommended. |
| Dissolution | Soluble in DMSO up to 50 mM. |
| Negative control |
|
MU140 |
| Physical and chemical properties for MU140 | |
| Molecular weight | 351.4 |
| Molecular formula | C23H17N3O |
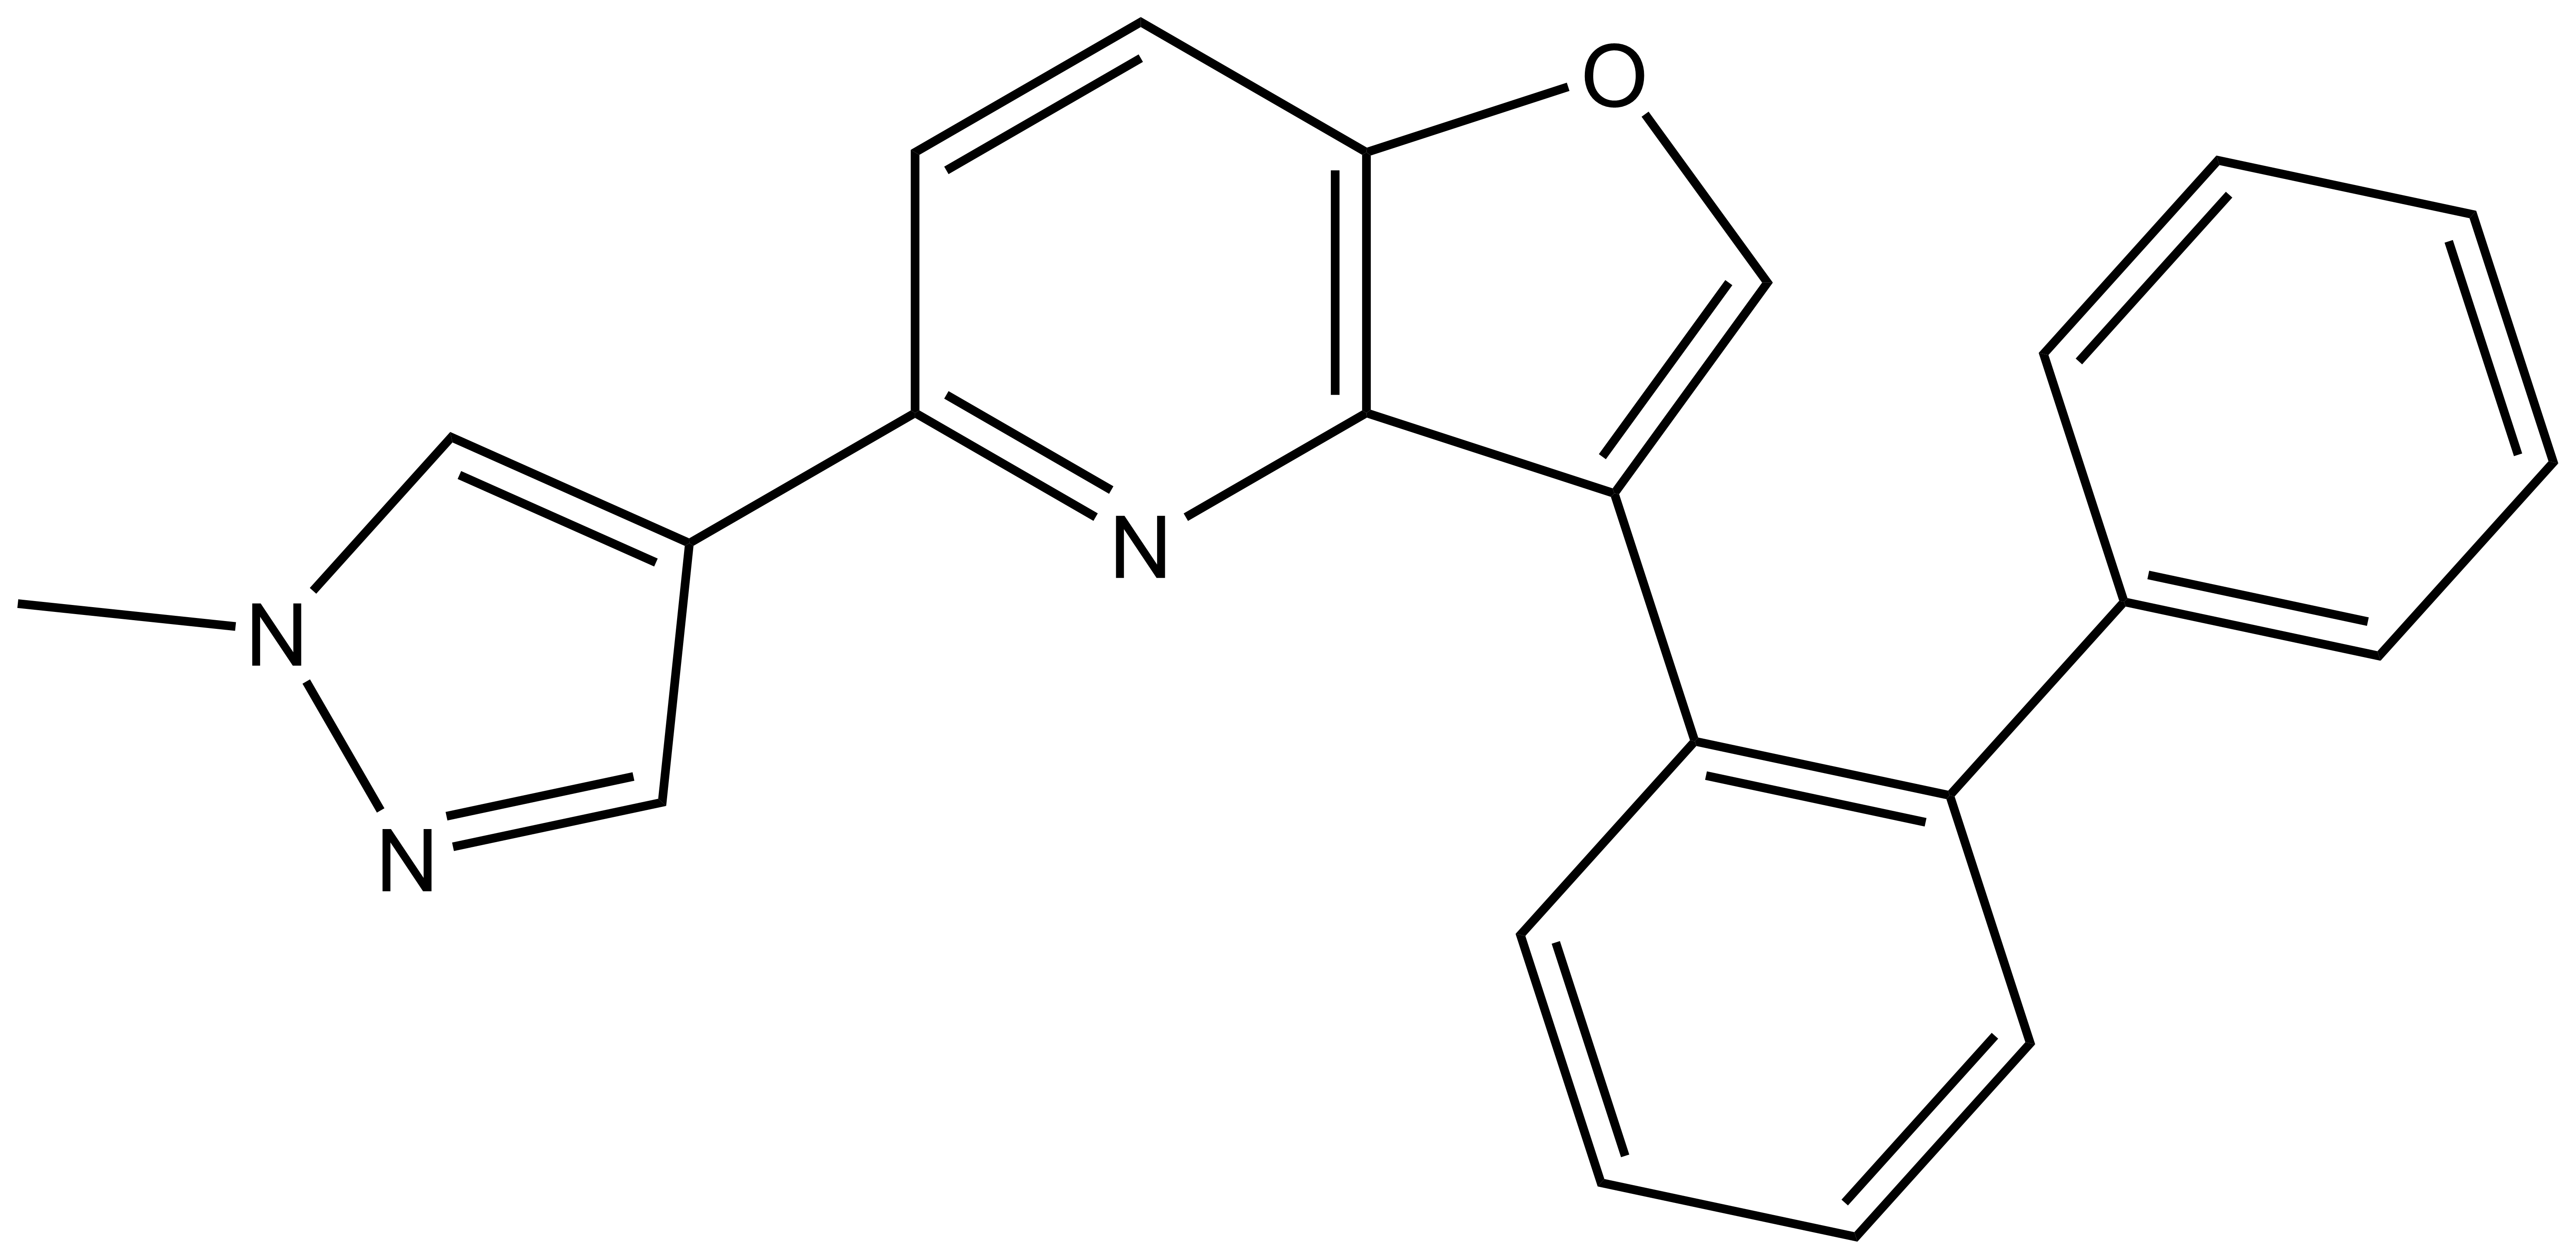
| IUPAC name | 5-(1-methylpyrazol-4-yl)-3-(2-phenylphenyl)furo[3,2-b]pyridine |
| MollogP | 5.05 |
| PSA | 43.85 |
| No. of chiral centres | 0 |
| No. of rotatable bonds | 3 |
| No. of hydrogen bond acceptors | 2 |
| No. of hydrogen bond donors | 0 |
| Storage | Stable as a solid in the dark at -20°C. NB making aliquots rather than freeze-thawing is recommended. |
| Dissolution | Soluble in DMSO up to 50 mM. |
SMILES:
MU1210: CN1C=C(C2=NC3=C(OC=C3C4=CC=CC(C5=CC=NC=C5)=C4)C=C2)C=N1
MU140: CN1C=C(C2=NC3=C(OC=C3C4=C(C5=CC=CC=C5)C=CC=C4)C=C2)C=N1
InChI:
MU1210: InChI=1S/C22H16N4O/c1-26-13-18(12-24-26)20-5-6-21-22(25-20)19(14-27-21)17-4-2-3-16(11-17)15-7-9-23-10-8-15/h2-14H,1H3
MU140: InChI=1S/C23H17N3O/c1-26-14-17(13-24-26)21-11-12-22-23(25-21)20(15-27-22)19-10-6-5-9-18(19)16-7-3-2-4-8-16/h2-15H,1H3
InChIKey:
MU1210: HEAGNKNMQVIVMM-UHFFFAOYSA-N
MU140: QSBNKGGRYOLZND-UHFFFAOYSA-N
Selectivity screening of MU1210 was determined against 210 kinases in an activity-based assay (Invitrogen) at 1 µM (Figure 1). Top hits of the screen are indicated in Table 1.
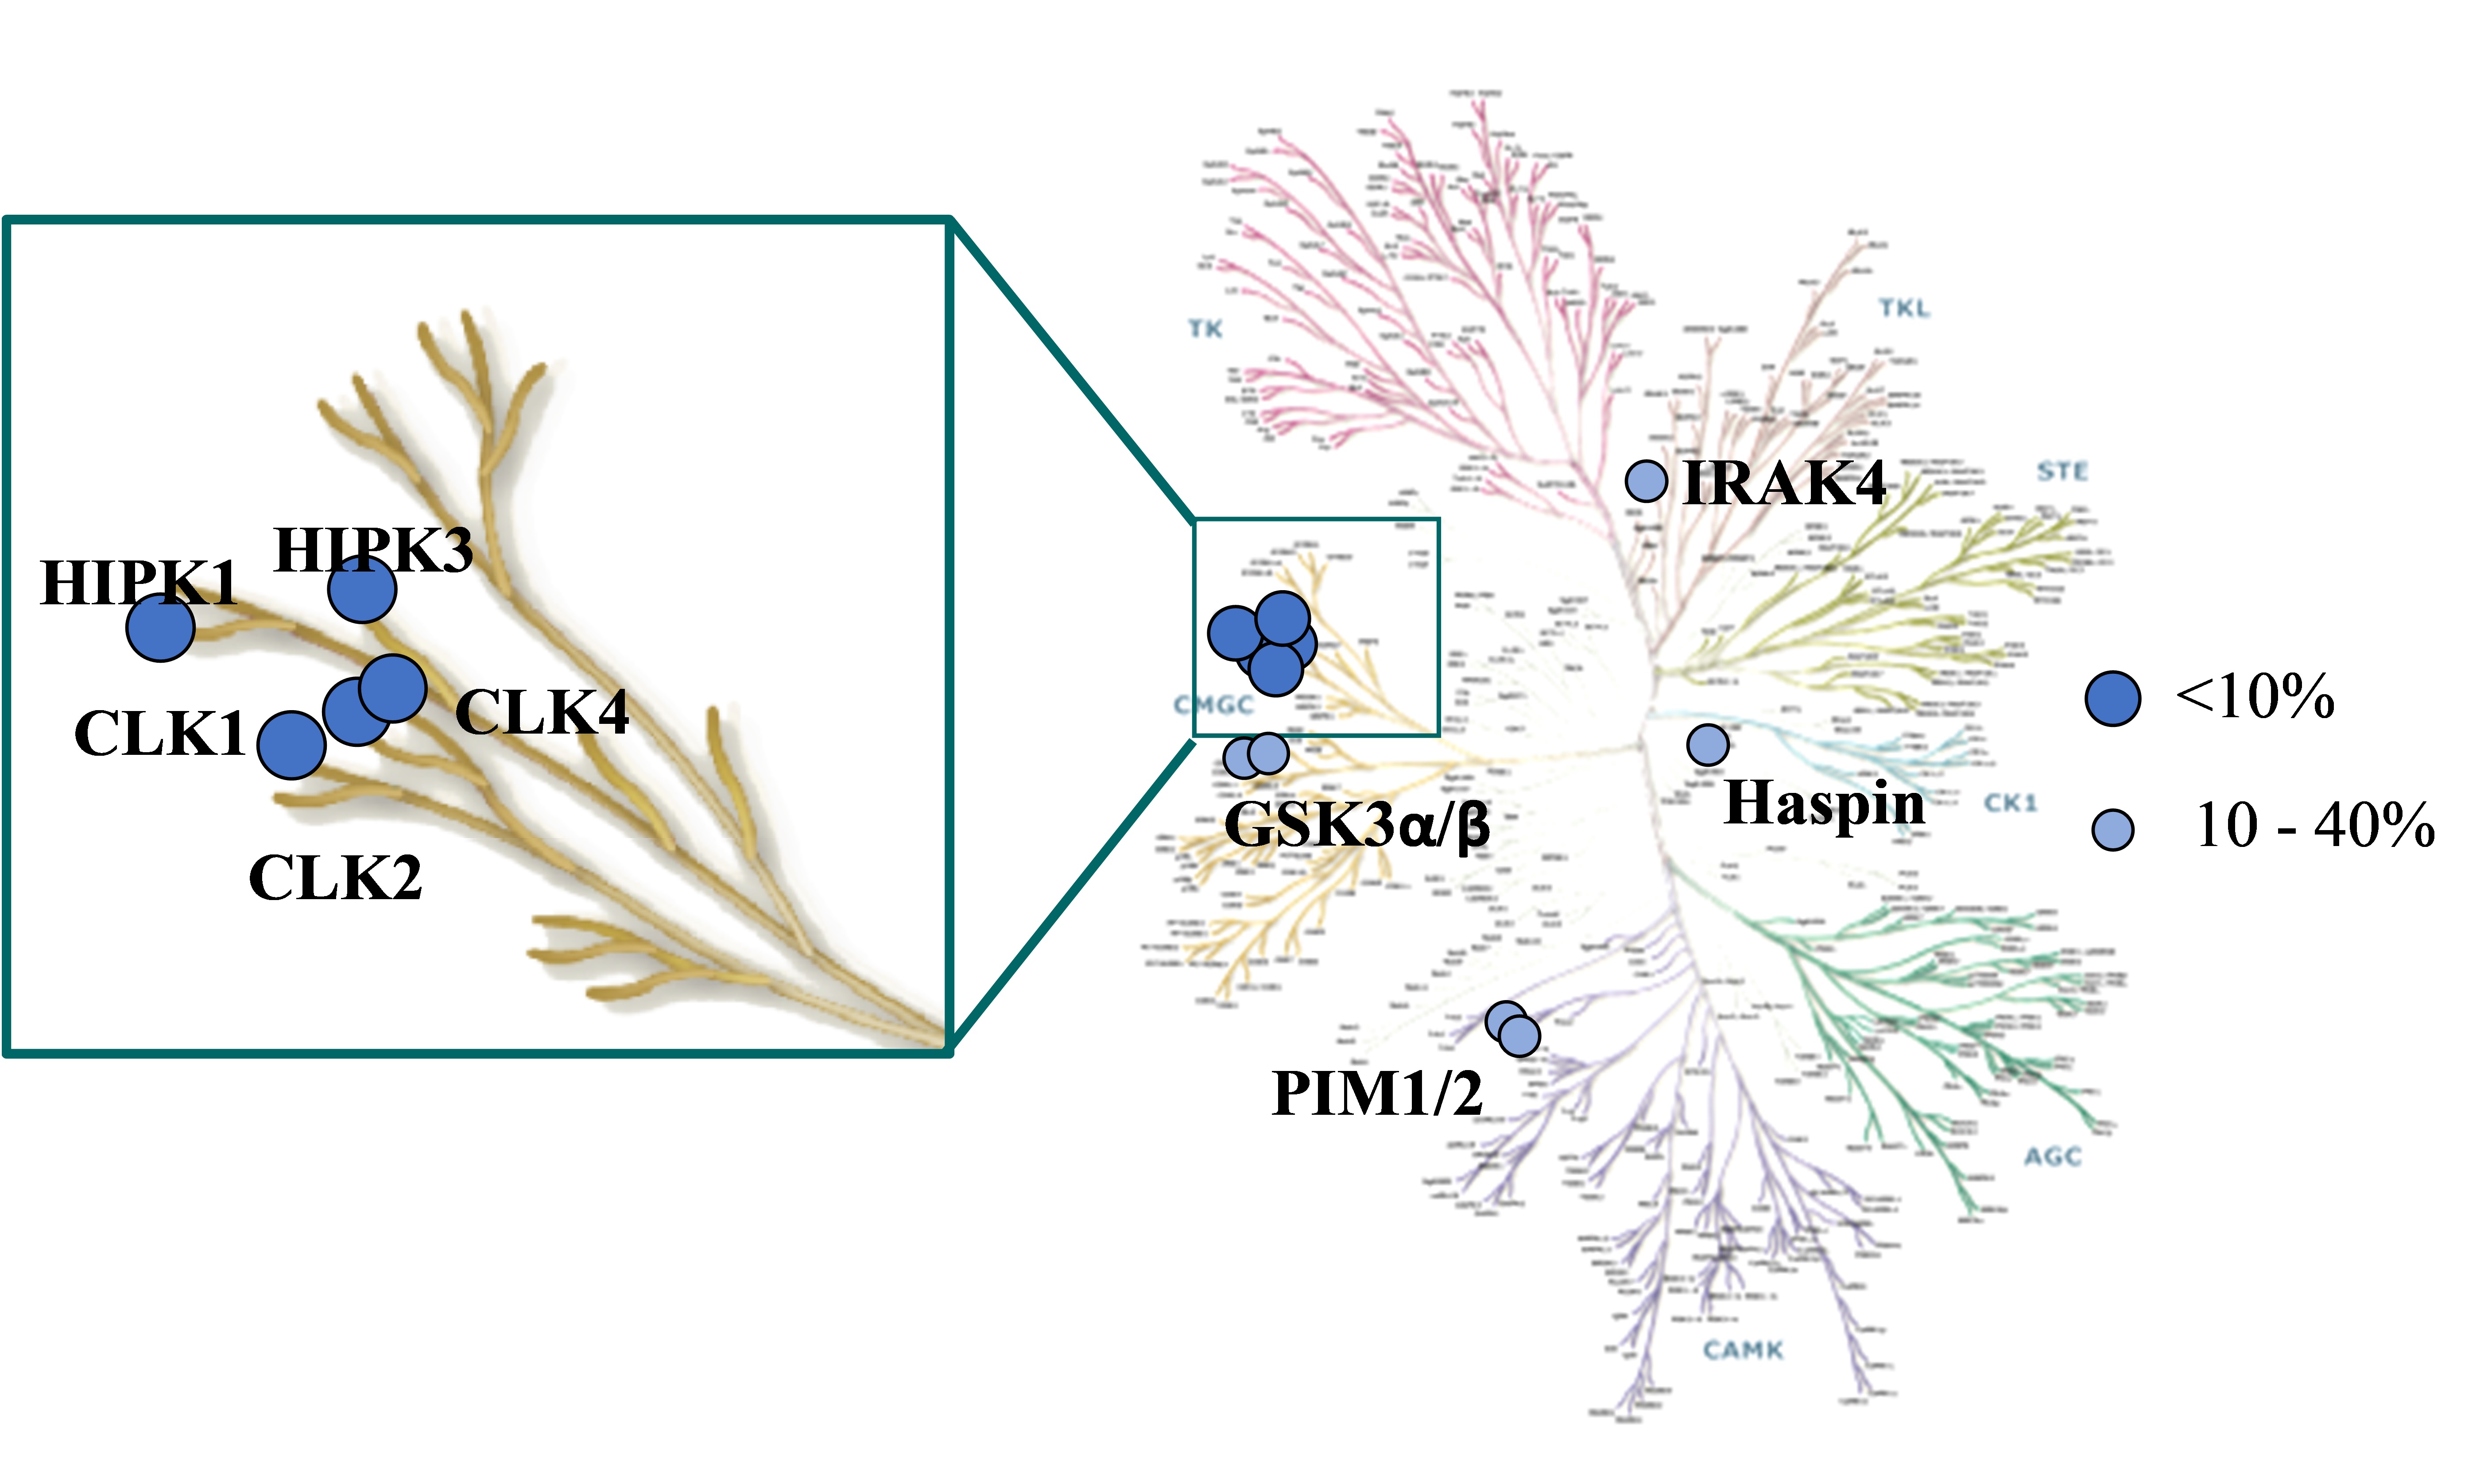
Figure 1: Visual representation of the top hits from MU1210 screened against a panel of 210 kinases.
| Target | |
| MU1210 (% Activity at 1 µM) | |
| CLK1 (h) | 1 |
| CLK2 (h) | 1 |
| CLK4 (h) | 1 |
| HIPK2 (h) | 1 |
| HIPK3 (h) | 6 |
| GSK3α (h) | 10 |
| PIM1 (h) | 16 |
| PIM3 (h) | 19 |
| Haspin (h) | 26 |
| GSK3β (h) | 38 |
| IRAK4 (h) | 40 |
| TrkA (h) | 42 |
| CaMKlly (h) | 43 |
Table 1: Potency Against Target Family. Please note DYRKs are not in this panel.
MU1210 is selective in a panel of 210 kinases in an activity-based assay (Invitrogen) at 1 µM. The closest off-target in the activity based screen HIPK2 was not inhibited in the cellular NanoBRET assays at 10 µM (Table 2).
| Kinase | Ki MU1210 (µM) | |
| Ki MU140 (µM) | ||
| CLK2 | 0.091 | >10 |
| HIPK2 | >01 | NA |
| HIPK4 | 5.41 | NA |
| DYRK1A | 6.58 | >10 |
| DYRK1B | >10 | >10 |
| DYRK2 | 1.7 | >10 |
Table 2: Confirmation of hit CLK2 in the cellular NanoBRET assay.
Hits from the kinase panel were assessed in a NanoBRET assay. MU1210 was much less active against HIPK2 and GSK3A/B in cells than in vitro (Figure 2). Kd values of Staurosporine are shown for comparison (Table 3) (6, 7).
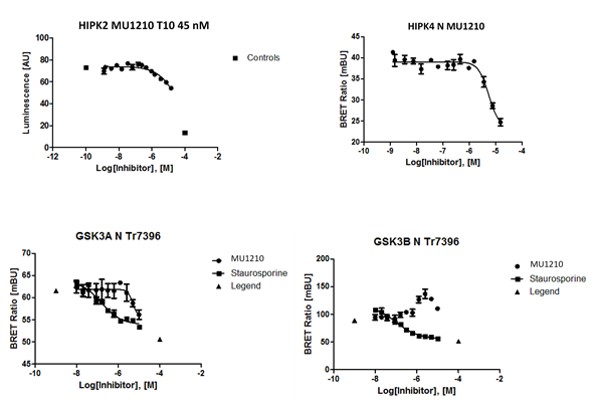
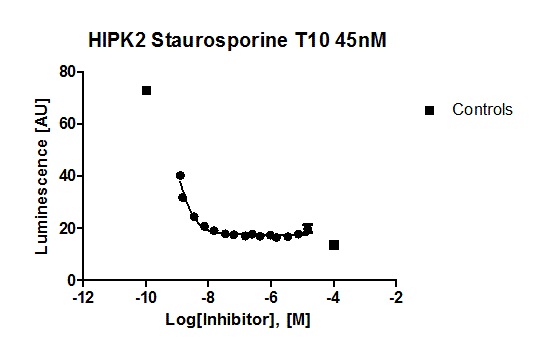
Figure 2: In vitro DSF assay of MU1210 and Staurosporine on potential off-targets.
| Compound | CLK1 | CLK4 | PIM1 | GSG2 | |
| GSK3β | |||||
| ΔTm MU1210 (oC) | 9.3 | 10.3 | -0.1 | 2.9 | 6.2 |
| ΔTm Staurosporine (oC) | 13.2 | 12.4 | 12.4 | 7.7 | 9.1 |
| Kd Staurosporine (nM) | 32 | 9.6 | 3.2 | NA | 69 |
Table 3: In vitro DSF assay of MU1210 and Staurosporine on potential off-targets.
In vitro phophorylation assays
In vitro phosphorylation assays are described in
NanoBRET assay
N-terminal NanoLuc and C-terminal NanoLuc/ kinase fusions, encoded in pFC32K expression vectors (Promega), were used. For cellular BRET target engagement experiments, HEK-293T were transfected with NLuc/target fusion constructs using FuGENE HD (Promega) according to the manufacturer’s protocol. Briefly, Nluc/target fusion constructs were diluted into Transfection Carrier DNA (Promega) at a mass ratio of 1:10 (mass/mass), diluted with OptiMEM media to a twentieth part of the volume of the HEK cells. FuGENE HD was added at a ratio of 1:3 (μg DNA: μL FuGENE HD). One part (vol) of FuGENE HD complexes was combined with 20 parts (vol) of HEK-293 cells suspended at a density of 2 x 10⁵ cells/ml and afterwards the mixture was incubated in a humidified, 37°C/5% CO2 incubator for 24 h. After this, the cells were washed and resuspendend in OptiMEM medium. For Target engagement assays 4 x 10³ cells/well were plated out in a 384-well plate (Greiner). For all experiments the recommended energy transfer probes (Promega) were used if possible at a final concentration of the Kd of the tracer on the target. In some cases higher tracer concentrations were used for better signal-to-noise ratios. Compounds and the energy transfer probe were added to the cells and incubated for 2h in humidified, 37°C/5% CO2 incubator. The chemical inhibitors were prepared as concentrated stock solutions in DMSO (Sigma-Aldrich) and diluted with OptiMEM for this experiment. Straight before the measurement NanoGlo Substrate and Extracellular NanoLuc Inhibitor (Promega) were mixed carefully with the supernatant. Luminescence was measured on a BMP PheraStar with 450 nm (donor) and 600 nm filters (acceptor) using 0.5 s integration time. Milli-BRET units (mBU) are calculated by multiplying the raw BRET values by 1000. Tracer and DMSO controls were used to calculate a normalized signal.
Inhibitory constants were calculated by using the sigmoidal dose-response (four parameters) equation in GraphPad Prism.
For a better comparison in between assays of different kinases Ki values were also calculated using the Cheng-Prusoff equation with the corresponding tracer Kds and the used tracer concentrations.
DSF assay
Purified, recombinant proteins were measured as described in (8).
In the NanoBRET assay MU1210 the following IC50 values were observed:
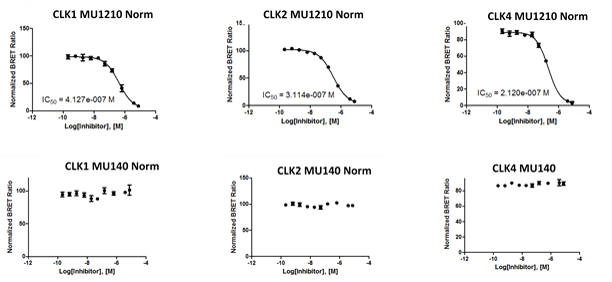
Figure 1: IC50 values from screening MU1210 and the negative control MU140 in the NanoBRET assay.
The Ki values as determined by NanoBRET assays in HEK293T cells were:
| Kinase | Ki MU1210 (µM) | |
| Ki MU140 (µM) | ||
| CLK1 | 0.084 | >10 |
| CLK2 | 0.091 | >10 |
| CLK4 | 0.023 | >10 |
| DYRK1A | 6.58 | >10 |
| DYRK1B | >10 | >10 |
| DYRK2 | 1.7 | >10 |
Table 1: Ki vales from screening MU1210 and the negative control MU140 in the NanoBRET assay.
After treatment of HeLa cells with MU1210 (VN339) for 3 hours the phosphorylation state of SR proteins was altered (Figure 2). MU1210 inhibited the phosphorylation of SRSF proteins in a dose-dependend manner, while the negative control MU140 had no effect on SRSF-phosphorylation.
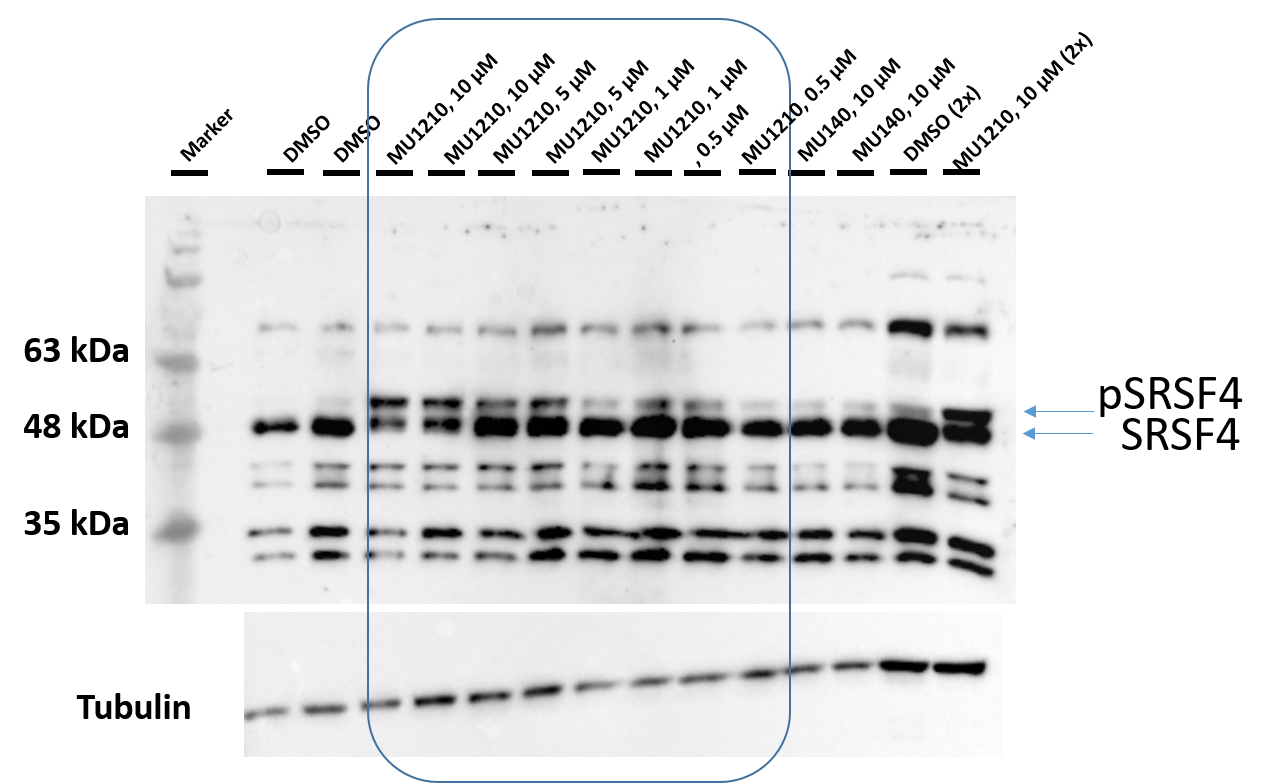
Figure 2: Western blot analysis of phosphorylation state of SR proteins following treatment with MU1210 and its negative control MU140.
Treatment with MU1210 at 10 µM affected the alternative splicing of Mdm4 in MCF7 cells leading to an accumulation of the shorter Mdm4 form (Mdm4-S) (Figure 3). No changes were observed compared to the DMSO control, as well as the negative control MU140.
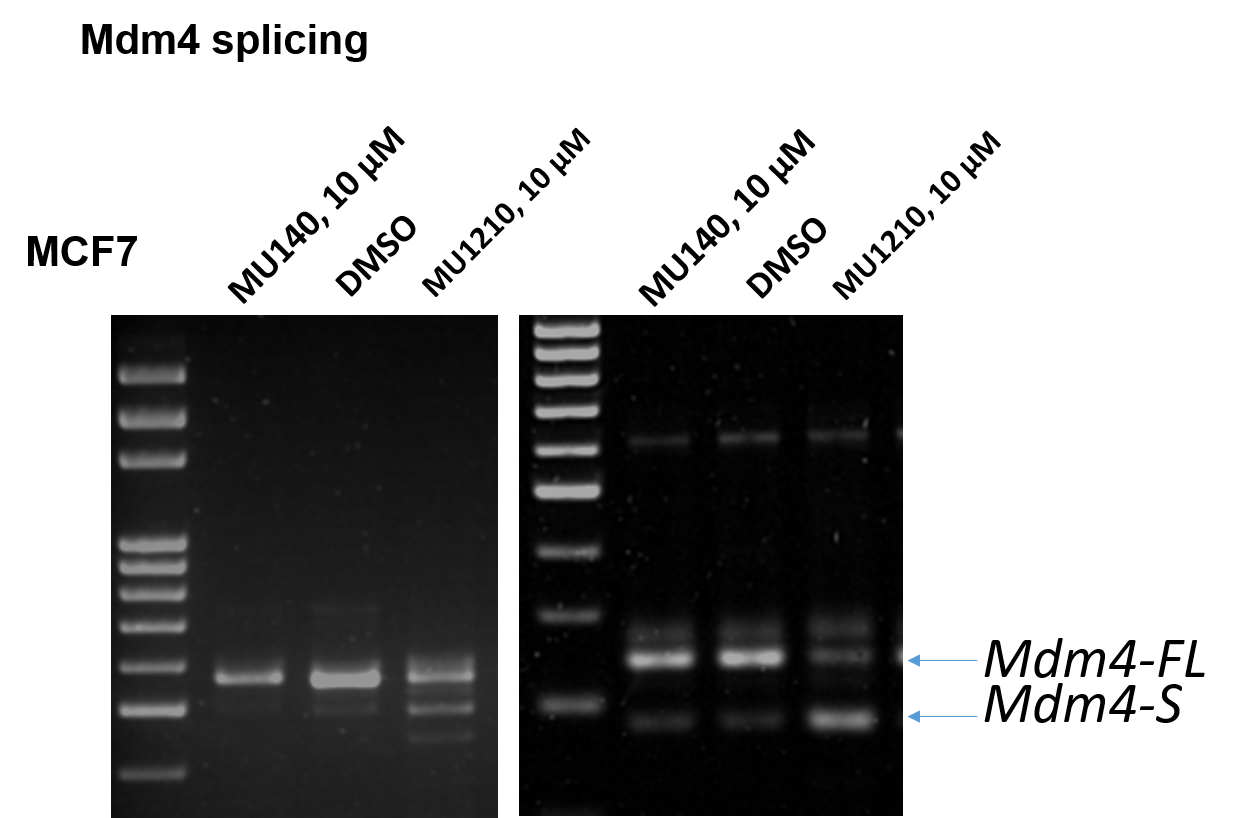
Figure 3: PCR showing alternative splicing following treatment with MU1210 (10 µM).
In vitro toxicity was assessed using a MTT assay. MU1210 was not toxic in cells at >1 µM after 24 hours. The negative control MU140 showed no significant toxicity after 24 hours, up to 35 µM
| Cell line | Toxicity (µM) |
| MDA-MB-231 | 1.3 |
| MCF-7 | 1.2 |
| MCF-10a | 1.5 |
Table 2: Cellular toxicity in selected cell lines. Cells were treated with MU1210 for 72 hours. Cellular toxicity was assessed using a MTT assay.
MU1210 induced severe impairment of cell proliferation at >1µM over a longer time period (Figure 4). The high initial concentration of 5 µM in MEF cells caused precipitations of the probe in the wells due to the limited solubility of the compound.
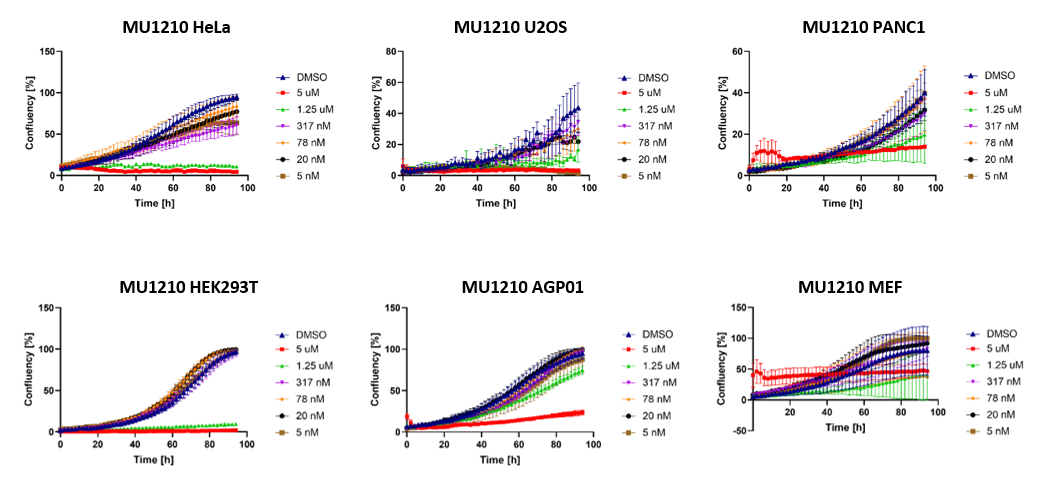
Figure 4: Cell proliferation following treatment with MU1210 in selected cell lines.
Western blot analysis
For the dose dependence change of phosphor-SRSF proteins in Hela cells, 200,000 cells in 3 ml DMEM containing 10% FBS and Penicillin/Streptomycin were seeded in 6 well plates for 24h. The in DMSO diluted compounds were added and incubated for the stated time. Afterwards the cells were lysed mixed with SDS loading buffer, briefly heated and loaded onto a 12% SDS gel. After running the gel and blotting onto a nitrocellulose membrane, anti-phospho-SR antibody (Merck-Millipore, MABE50) was used to analyse the level of phosphorylated SRSF proteins. After washing steps, the membrane was incubated with anti-mouse antibodies coupled with horseradish peroxidase and analysed. Tubulin acted as a loading control.
Splicing analysis
The Mdm4 splicing in MCF7 cells is described in
Cellular proliferation
For the proliferation assay cells were seeded between 100-200 cells/well in a 384 clear bottom plate (Nunc) in DMEM containing 10 % FBS and Penicillin/Streptomycin. After 24h compounds were added by an acoustic dispenser (ECHO) directly in each well. Proliferation was measured by determining the confluency over time in an Incucyte S3 automated microscope.
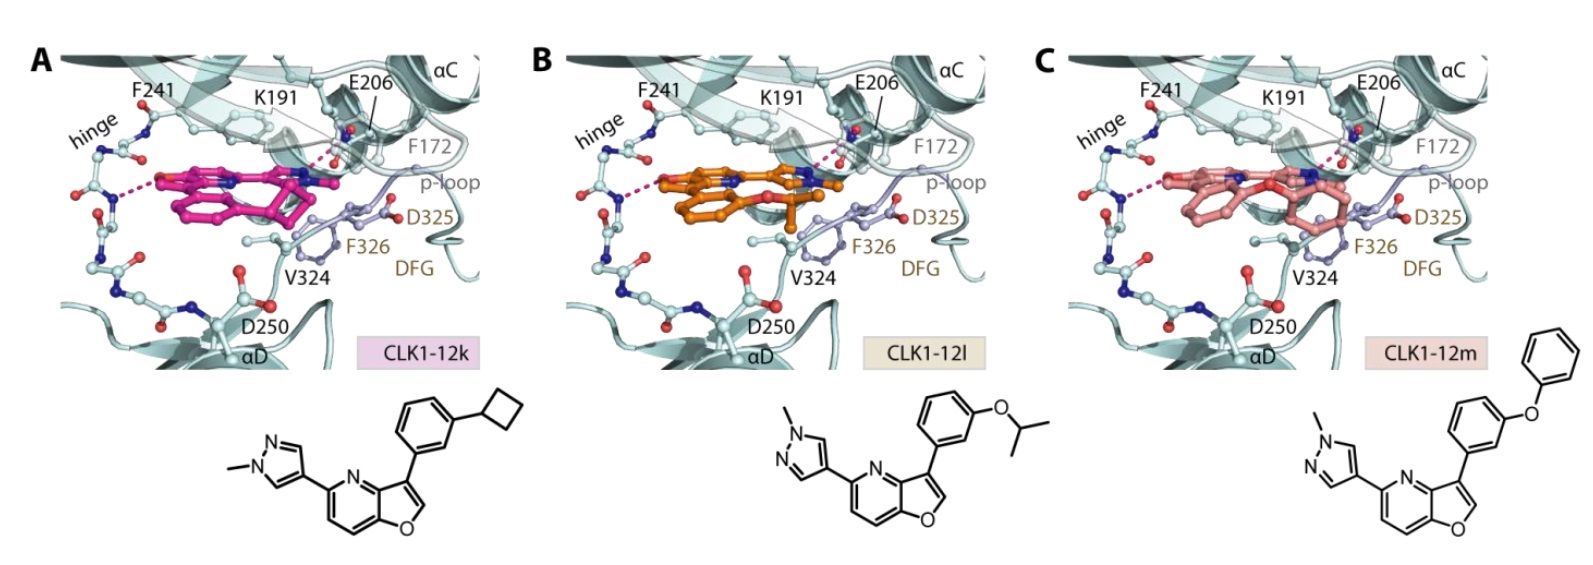
Work on this probe has been published in Furo[3,2-b]pyridine: A Privileged Scaffold for Highly Selective Kinase Inhibitors and Effective Modulators of the Hedgehog Pathway