This probe is available from Cayman Chemical, Sigma (hydrate) and Tocris.
| Probe | Negative control | |
 |  | |
UNC0638 | UNC0737 |
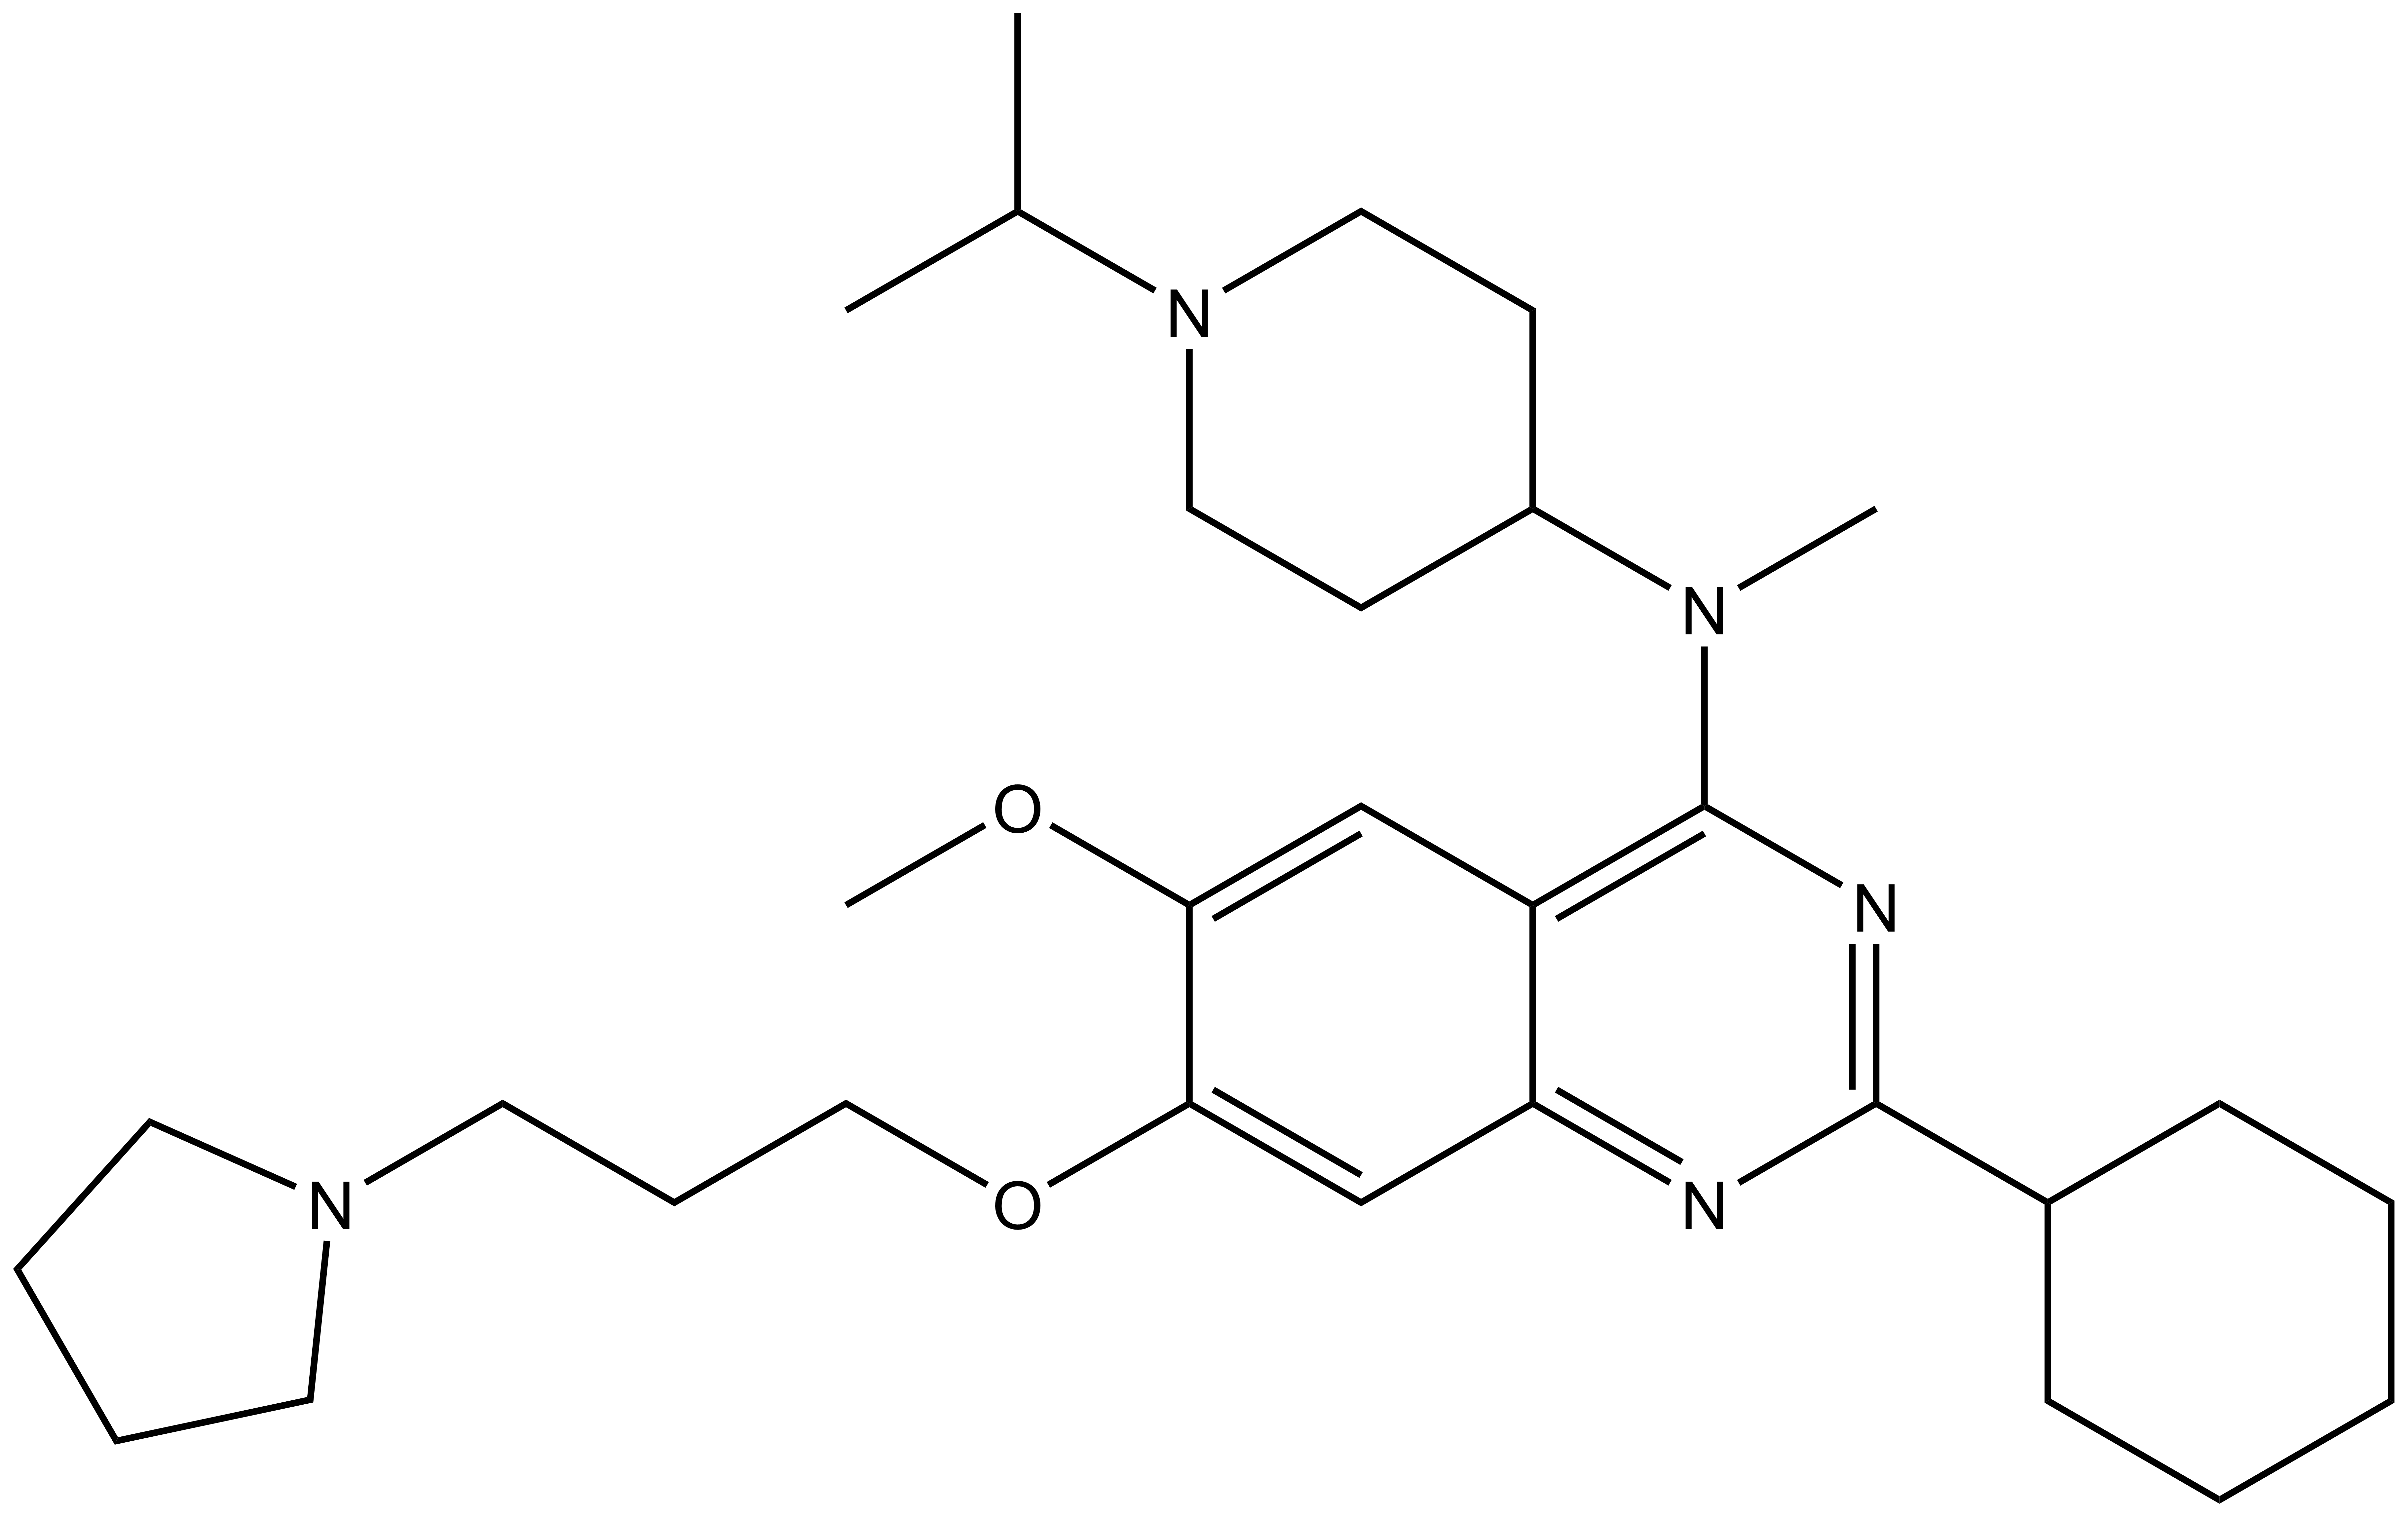
G9a (EHMT2) and GLP (EHMT1) catalyze the mono and dimethylation of lysine 9 of histone 3 (H3K9) and other non-histone substrates such as p53 and WIZ. UNC0737, the N-methyl analog of UNC0638, was a poor inhibitor of G9a and GLP. The combination of the high structural similarity between UNC0737 and UNC0638 and the >300-fold loss of potency in UNC0737 compared to UNC0638 makes UNC0737 an appropriate negative control for use in cellular and functional assays.
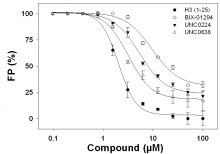
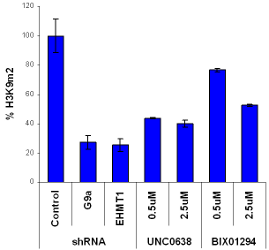
Significant reduction in H3K9 dimethylation at 100nM in MDA-MB231 cells as measured by fluorescence immunostaining without significant cellular toxicity.
| Protein | IC50/nM (Activity) | Tm shift °C 1 |
|---|---|---|
| G9a (EHMT2) | <15 (hill slope 1.3) | 4 |
| GLP (EHMT1) | 19±1 (hill hlope 0.8) | 8 |
| SETD7 | >10,000 | nt |
| SETD8 | >10,000 | nd |
| PRMT3 | >10,000 | nd |
| SUV39H2 | >10,000 | nt |
| DOT1L | nt | nd |
| PRDM1 | nt | nd |
| PRDM10 | nt | nd |
| PRDM12 | nt | nd |
| SMYD3 | nt | nd |
| JMJD2E | 4660 (AlphaScreen) | nt |
| HTATIP | nt | nd |
(nt=not tested, nd=not detected, 1 singlicate determination @ 100 µM)
>30% Inhib @ 1µM
| Receptor | %Inhib |
|---|---|
| Adrenergic alpha1A | 90 |
| Adrenergic alpha1B | 69 |
| Muscarinic M2 | 64 |
 |
| 2-cyclohexyl-N-(1-isopropylpiperidin-4-yl)-6-methoxy-7-(3-(pyrrolidin-1-yl)propoxy) quinazolin-4-amine Click here to download SDF file |
| Physical and chemical properties | |
|---|---|
| Molecular weight | 509.7 |
| Molecular formula | C30H47N5O2 |
| IUPAC name | 2-cyclohexyl-N-(1-isopropylpiperidin-4-yl)-6-methoxy-7-(3-(pyrrolidin-1-yl)propoxy) quinazolin-4-amine |
| logP | 5.78 |
| PSA | 62.0 A2 |
| No. of chiral centres | 0 |
| No. of rotatable bonds | 10 |
| No. of hydrogen bond acceptors | 6 |
| No. of hydrogen bond donors | 1 |
| Storage | Stable as solid in the dark at -20°C. |
| Dissolution | Soluble in DMSO at least up to 10mM |
| Protein | IC50/nM (Activity) | Tm shift °C 1 |
|---|---|---|
| G9a (EHMT2) | <15 | 4 |
| GLP (EHMT1) | 19 ± 1 | 8 |
| SETD7 | >10,000 | nt |
| SETD8 | >10,000 | nd |
| PRMT3 | >10,000 | nd |
| SUV39H2 | >10,000 | nt |
| DOT1L | nt | nd |
| PRDM1 | nt | nd |
| PRDM10 | nt | nd |
| PRDM12 | nt | nd |
| SMYD3 | nt | nd |
| JMJD2E | 4660 (AlphaScreen) | nt |
| HTATIP | nt | nd |
(nt=not tested, nd=not detected, 1 singlicate determination @ 100 µM)
| Target | IC50 / nM (Activity) |
|---|---|
| DNMT1 | 1287** |
| MLL | >10,000** |
| EZH2 | >10,000** |
| PRMT1 | >10,000** |
| SUV39H1 | >10,000** |
| SUV39H2 | >10,000** |
| G9a | 91** |
**Screened at BPS Bioscience using different format
| Tm shift °C | |||||
|---|---|---|---|---|---|
| Protein | Screening Methods | UNC0638 µM | |||
| 1 | 10 | 100 | 500 | ||
| DOT1L | DSF | ||||
| PRDM1 | DSF | ||||
| PRDM10 | DSF | ||||
| PRDM12 | DSF | ||||
| SMYD3 | DSF | ||||
| HIATIP | DSF | ||||
| EHMT1 | DSF | 5 | 8 | 6 | |
| G9a | DSF | 2 | 4 | 4 | |
| SETD8 | DSLS | ||||
| PRMT3 | DSLS | ||||
Blank box indicates Tm shift of <2 °C
Radioligand binding performed at Ricerca
>30% Inhib @ 1 µM
| Receptor | %Inhib |
|---|---|
| Adrenergic alpha1A | 90 |
| Adrenergic alpha1B | 69 |
| Muscarinic M2 | 64 |
<30% Inhib @ 1 µM
| Receptor | |
|---|---|
| Transporter, Norepinephrine (NET) | Glutamate, NMDA, Phencyclidine |
| Nicotinic Acetylcholine Alpha1, Bungarotoxin | Adenosine A2A |
| Dopamine D2S | Calcium Channel L-Type, Dihydropyridine |
| GABAA, Flunitrazepam, Central | GABAA, Muscimol, Central |
| Sodium Channel, Site 2 | Histamine H1 |
| Potassium Channel hERG | Adenosine A1 |
| Cannabinoid CB1 | Rolipram |
| Dopamine D1 | Potassium Channel[KATP] |
| Nicotinic Acetylcholine | Adrenergic beta1 |
| Adrenergic beta2 | Prostanoid EP4 |
| Muscarinic M3 | Serotonin (5-Hydroxytryptamine) 5-HT2B |
| Opiate mu (OP3, MOP) | Phorbol Ester |
| Adrenergic alpha2A | Sigma1 |
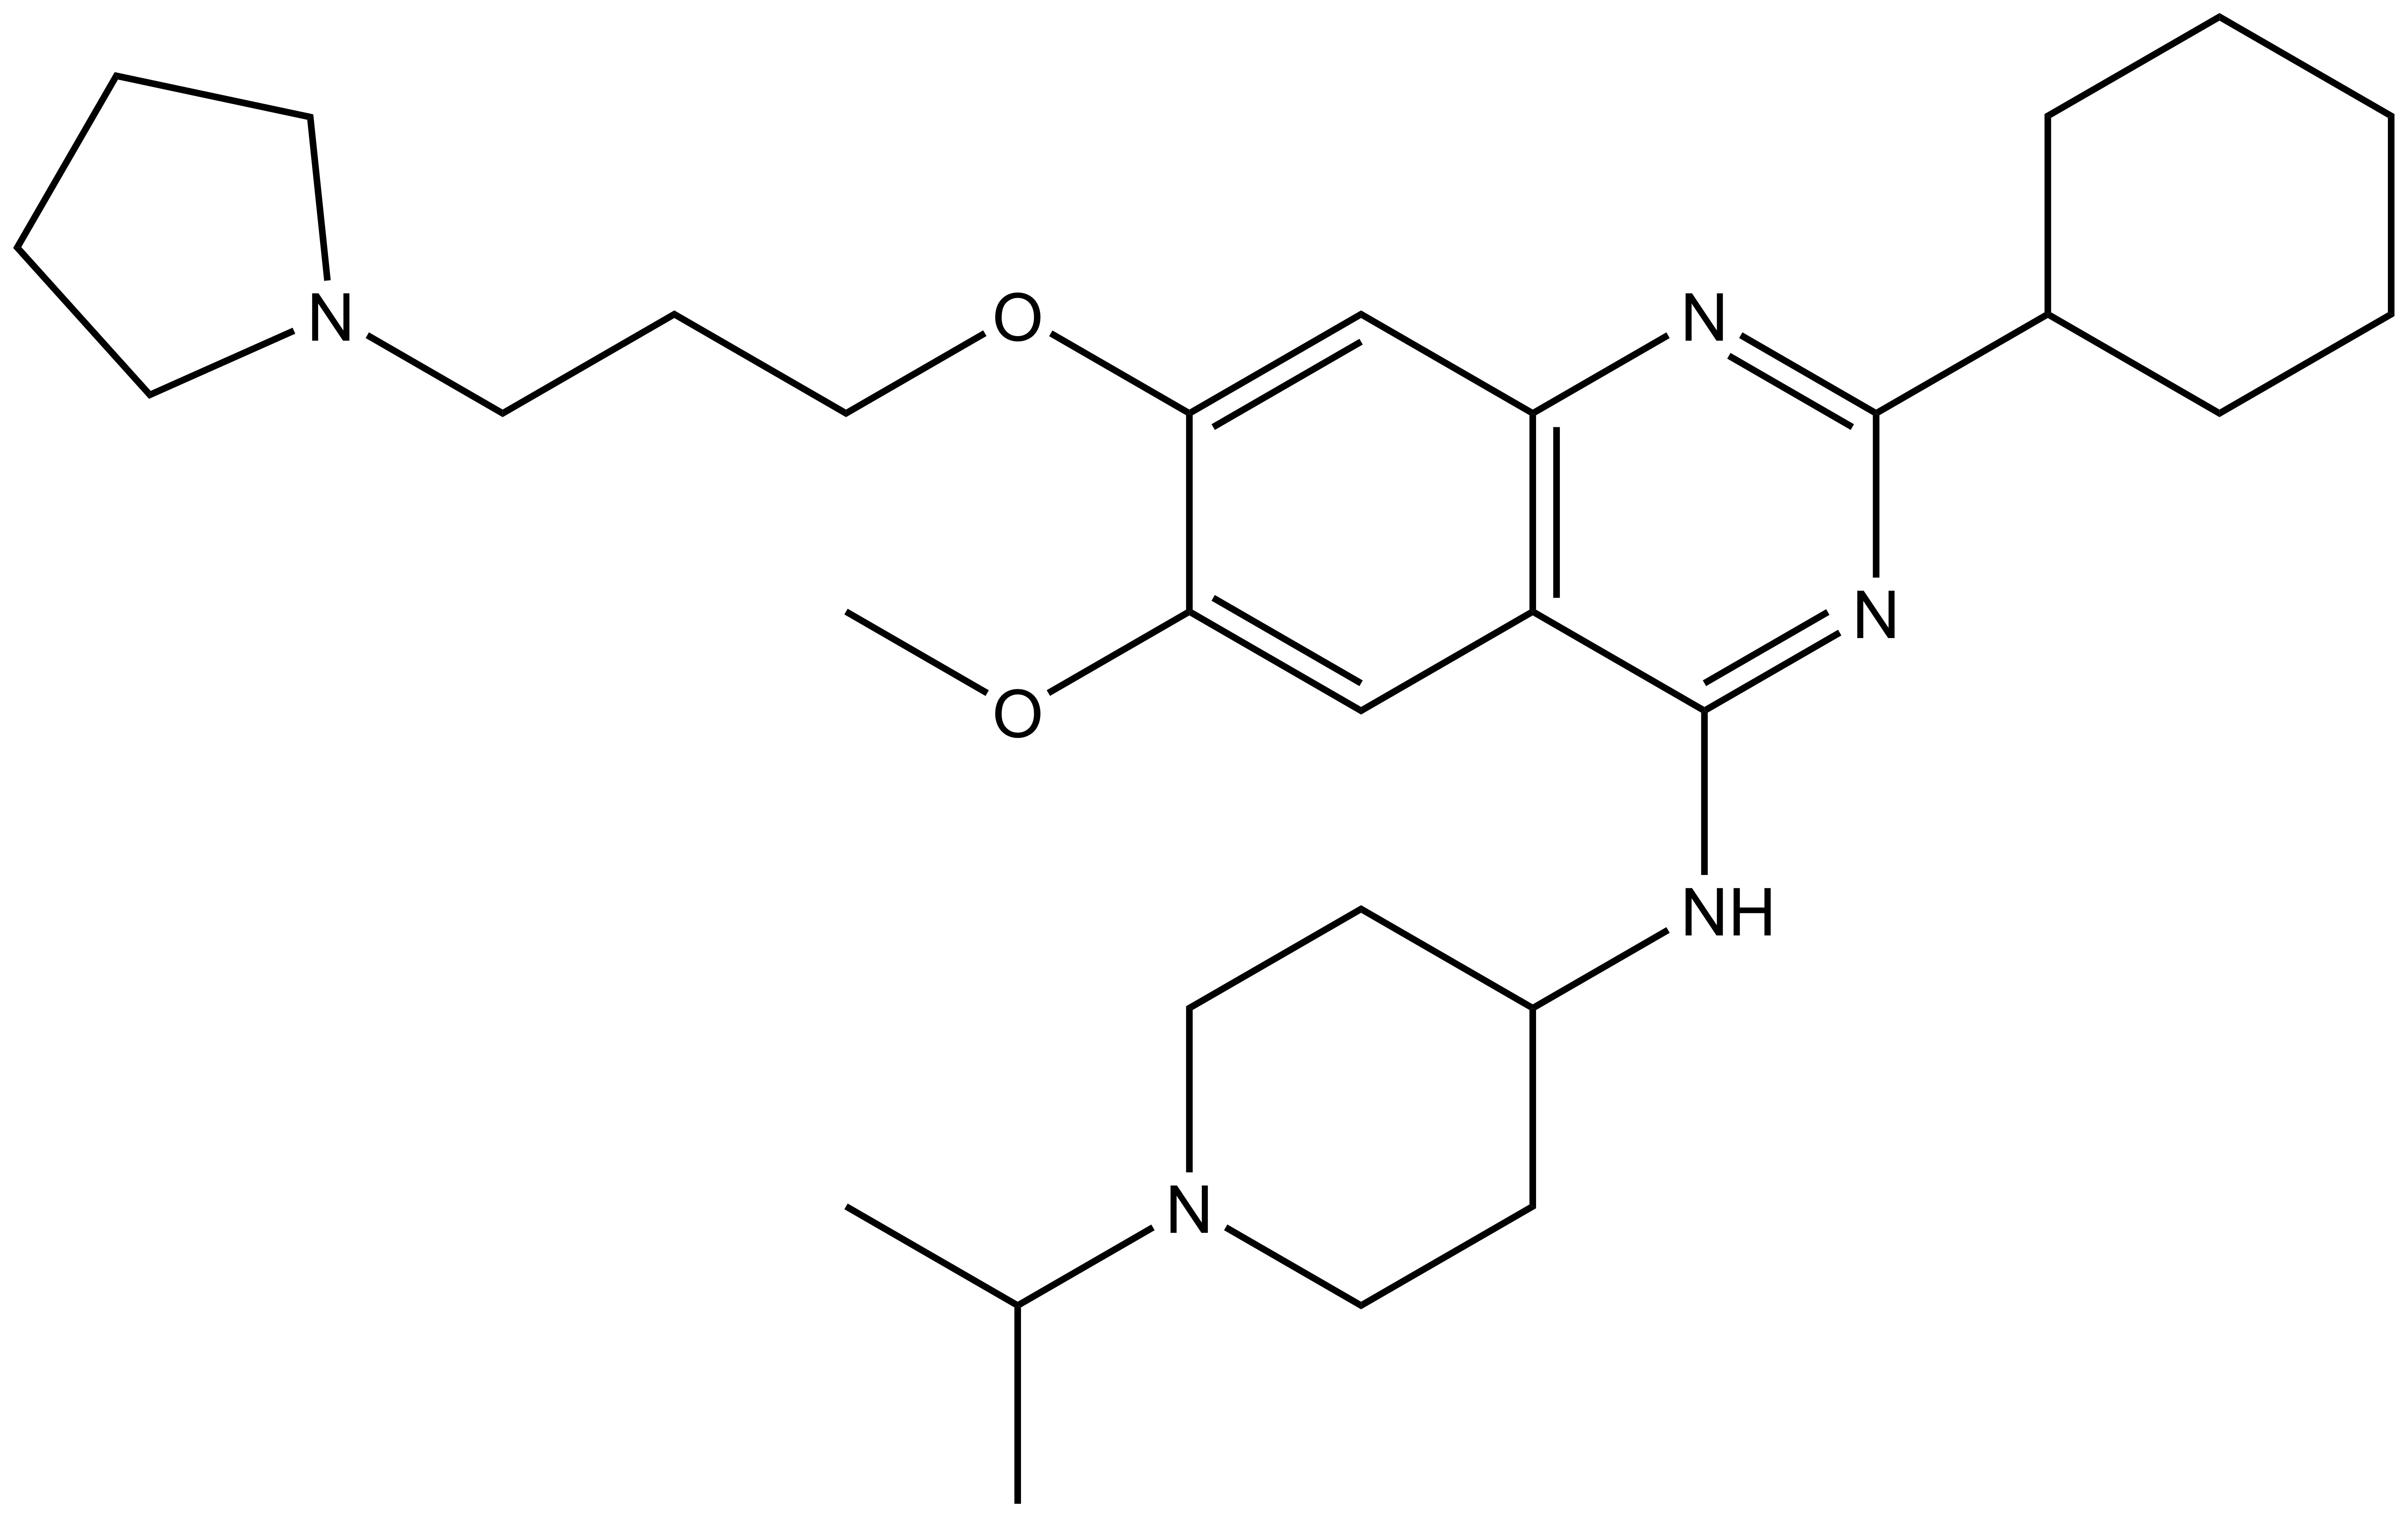
Peptide Displacement Measured by FP (click image for larger version)
Histone methyltransferase assay was performed using a coupled assay originally developed by Collazo et al. 2005. In this assay SAHH (S-adenosylhomocysteine hydrolase) and adenosine deaminase convert the methyltransferase reaction product (S-adenosylhomocysteine) to homocysteine and inosine. Homocysteine can be quantified using Thioglo-1 (Calbiochem). Substrate peptides used in this assay were: the first 25 residues of histone 3 [H3 (1-25)] for G9a, EHMT1 and SETD7 at 10, 20 and 100 µM respectively; the first 24 residues of histone 4 [H4 (1-24)] at 10 and 500 µM for PRMT3 and SETD8 respectively; and H3K9Me1 [H3 (1-15), monomethylated at lysine 9] at 200 µM for SUV39H2. The assay mixtures were prepared in 25 mM potassium phosphate buffer pH 7.5, 1 mM EDTA, 2 mM MgCl2, 0.01% Triton X-100 with 5 µM SAHH , 0.3 U/ml of adenosine deaminase from Sigma, 25 µM SAM, and 15 µM Thioglo-1. G9a (25 nM), EHMT1 (100 nM), SUV39H2 (100 nM), SETD7 (200 nM) and PRMT3 (1 µM) were assayed in the presence of UNC0638 at concentrations ranging from 4 nM to 16 µM. After 2 min incubation, reactions were initiated by the addition of above mentioned histone peptides. The methylation reactions were followed by monitoring the increase in fluorescence using BioTek Synergy2 plate reader with 360/40 nm excitation filter and 528/20 nm emission filter for 20 min in 384-well format. SETD8 (250 nM) was assayed under the same conditions; however the Thioglo-1 was added at the end of the reaction for quantification. The peptide and protein background were subtracted. IC50 values were calculated using Sigmaplot and the standard deviations were calculated from two independent experiments. SAHH clone was provided by Dr. Trievel, University of Michigan.
DOT1L, PRDM1, PRDM10, PRDM12, SMYD3, HIATIP, G9a, EHMT1 and SETD7 were screened for binding to UNC0638 by DSF. A real-time PCR device (RTPCR 480 II) from Roche was used to monitor protein unfolding by monitoring the increase in the fluorescence of the fluorophor SYPRO Orange (Invitrogen, Carlsbad, CA) as described before (Niesen et al. 2007; Vedadi et al. 2006). Protein samples ranging from 0.05 to 0.2 mg/mL in 100 mM Hepes buffer (pH 7.5) containing 150 mM NaCl, and 0, 1, 10 and 100 µM of the compound were screened. Compound dilutions were made from stock solutions of 100% DMSO. The final concentration of DMSO was kept at 0.2% throughout the dilutions. All these solutions contained 5x Sypro Orange. 20 µL aliquots were transferred to a 384-well PCR plate and scanned at a heating rate of 1 °C/min from 20 to 95 °C. Fluorescence intensities were plotted as a function of temperature by using an internally developed software package (Vedadi et al. 2006).
SETD8 and PRMT3 were screened for binding to UNC0638 by DSLS. Temperature-dependent aggregation was measured by using static light scattering (StarGazer) (Vedadi et al. 2006, Senisterra et al. 2006). Fifty microliters of protein (0.4 mg/ml) was heated from 27°C to 85°C at a rate of 1°C per min in each well of a clear-bottom 384-well plate (Nunc, Rochester, NY) in the presence of 0, 1, 10 and 100 µM of UNC0638. Incident light was shone on the protein drop from beneath at an angle of 30°. Protein aggregation was monitored by measuring the intensity of the scattered light every 30 s with a CCD camera. The pixel intensities in a preselected region of each well were integrated to generate a value representative of the total amount of scattered light in that region. These total intensities were then plotted against temperature for each sample well and fitted to the Boltzman equation by nonlinear regression. The resulting point of inflection of each resulting curve was defined as the Tagg.
Fluorescence polarization (FP) measurements were performed in 384 well-plates, using Synergy 4 microplate reader from BioTek. H3 (1-15) peptide (ARTKQTARKSTGGKA) was synthesized, N-terminally labeled with fluorescein [F-H3 (1-15)] and purified by Tufts University Core Services (Boston, MA, USA). Displacement of F-H3 (1-15) peptide was monitored using the fluorescence polarization signal obtained upon peptide binding to G9a protein. G9a (4 µM in 20 mM Tris pH 8.0, 250 mM NaCl, 500 µM SAH, and 0.01% Triton) was incubated with 40 nM F-H3 (1-15) peptide, and different concentrations of BIX-01294 (purchased from Sigma-Aldrich), UNC0224, UNC0638 and unlabeled H3 (1-25) peptide from 0.1 to 100 µM were added. Displacement of peptide was monitored by following the decrease in FP signal. Data were normalized and plotted as percentage, and fit to a hyperbolic function using Sigma Plot software.
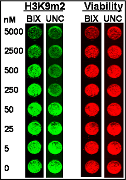
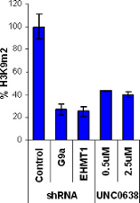
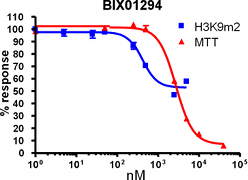
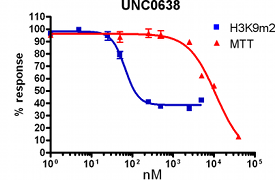
H3K9Me2 immunostaining and cell viability measured in MDA-MB231 cells after 48h exposure to BIX-01294 or UNC0638. UNC0638 exhibits a dose-dependant reduction in H3K9 dimethylation, while being more potent and efficacious than BIX-01294.
UNC0638 clearly shows an improved toxicity profile both in absolute terms and relative to its cell-based activity. This property will enable the use of UNC0638 without concern about possible complications of cellular toxicity.
| In vitro G9a IC50(nM) | H3K9Me2 48h IC50(nM) | Tox 48h EC50(nM) | Tox/Func Ratio | |
|---|---|---|---|---|
| BIX-01294 | 133 ± 15 | 500 ± 43 | 2805 | 5.6 |
| UNC0638 | <15 | 81 ± 9 | 11190 | 138 |
MDA-MB231 cells were cultured in RPMI with 10% FBS and MCF7 cells cultured in DMEM with 10% FBS.
Cells were grown in the presence or absence of inhibitors for stated amount of time. The media was removed and replaced with DMEM 10% FBS without phenol red supplemented with 1mg/ml of MTT (3-(4,5-dimethylthiazol-2-yl)-2,5-diphenyl tetrazolium bromide) and incubated for 1-2h. Live cells reduce yellow MTT to purple formazan. The resulting formazan was solubilized in acidified isopropanol and 1% Triton and absorbance measured at 570nm, corrected for 650nm background.
Cells were grown in 96-well plates in the presence of inhibitors as stated in figures. Media was removed by flicking and 2% formaldehyde in PBS added for 15min. After five washes with 0.1% Triton X100 in PBS, cells were blocked for 1h with 1% BSA in PBS. Three out of four replicates were exposed to primary H3K9m2 antibody, Abcam #1220 at 1/800 dilution in 1% BSA, PBS for 2h. One replicate was reserved for background control. The wells were washed five times with 0.1% Tween 20 in PBS, then secondary IR800 conjugated antibody (LiCor) and DNA-intercalating dye, DRAQ5 (LiCor) added for 1h. After 5 washes with 0.1% Tween 20 in PBS, the plates were read on Odyssey (LiCor) scanner at 800nm (H3K9m2 signal; 764nm excitation) and 700nm (DRAQ5 signal; 683nm excitation). Fluorescence intensity was quantified, normalized to background and DRAQ5 signal expressed as percentage of control.
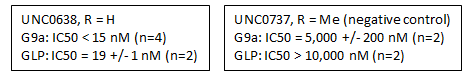
shRNAs were obtained from The RNAi Consortium (TRC) (Dr J Moffat) and processed and used as outlined in the TRC protocols.
G9a shRNA: NM_025256.4-3163s1c1; EHMT1 shRNA NM_024757.3-346s1c1; Control promegaLuc_221s1c1
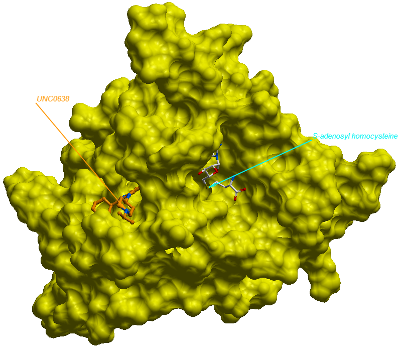
Human euchromatic histone-lysine N-methyltransferase 2 (G9a/EHMT2) in complex with UNC0638 (pdb code 3NNI)
3RJW: Dong A, Wasney GA, Tempel W, Liu F, Barsyte D, Allali-Hassani A, Chen X, Chau I, Hajian T, Senisterra G, Chavda N, Arora K, Siarheyeva A, Kireev DB, Herold JM, Bochkarev A, Bountra C, Weigelt J, Edwards AM, Frye SV, Arrowsmith CH, Brown PJ, Jin J, Vedadi M
PDB Code: 3RJW (deposited on 15.Apr.11)
Datapack version: 1 (built on 28.Jun.11; last revised on 29.Jun.11)