| Probe | | Negative control |
 | |  |
NVS-PAK1-1 | | NVS-PAK1-C |
Biology of the PAK1 kinase
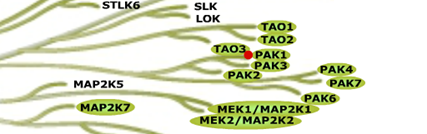
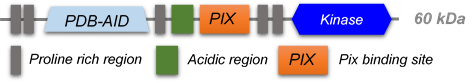
PAK kinases belong belong to the family of STE kinases, named after the yeast STE7, STE11 and STE20 genes, which form the MAPK cascade, transducing signals from the surface of the cell to the nucleus. The PAK family itself consist of 6 members and can be subdivided into 2 groups Group I PAKs (PAK1-3) and Group II PAKs (PAK 4-6). Group I PAKs (1-3) contain a N-terminal PBD-AIN domain and a kinase domain as well as two SH3-domains and one non-classical SH3-domain.
PAK1 is involved in many intracellular signaling pathways downstream of integrins and receptor-type kinases and plays an important role in in cell adhesion, cytoskeleton dynamics, migration, proliferation, apoptosis, mitosis, and in vesicle-mediated transport processes. It also plays a role in the regulation of insulin secretion in response to elevated glucose levels. PAKs have been shown to activate components of ERK, AKT and WNT signaling pathway and functions as GTPase effector that links the Rho-related GTPases CDC42 and RAC1 to the JNK MAP kinase pathway. PAK1 phosphorylates and activates MAP2K1, and thereby mediates activation of downstream MAP kinases.
PAK1 has been found to be overexpressed and/or activated in many tumor types and its expression levels have been correlated with patient prognosis. In addition Group I PAKs have been implicated in neurodegenerative disorders like Alzheimer and Huntington diseases as well as FXS (fragile X syndrome).
We recommend using NVS1-PAK1-1 at 2.5 uM for PAK1/2 inhibition or 0.25 uM for PAK1 inhibition.
The inactive control at similar concentration has no effect on PAK1/2
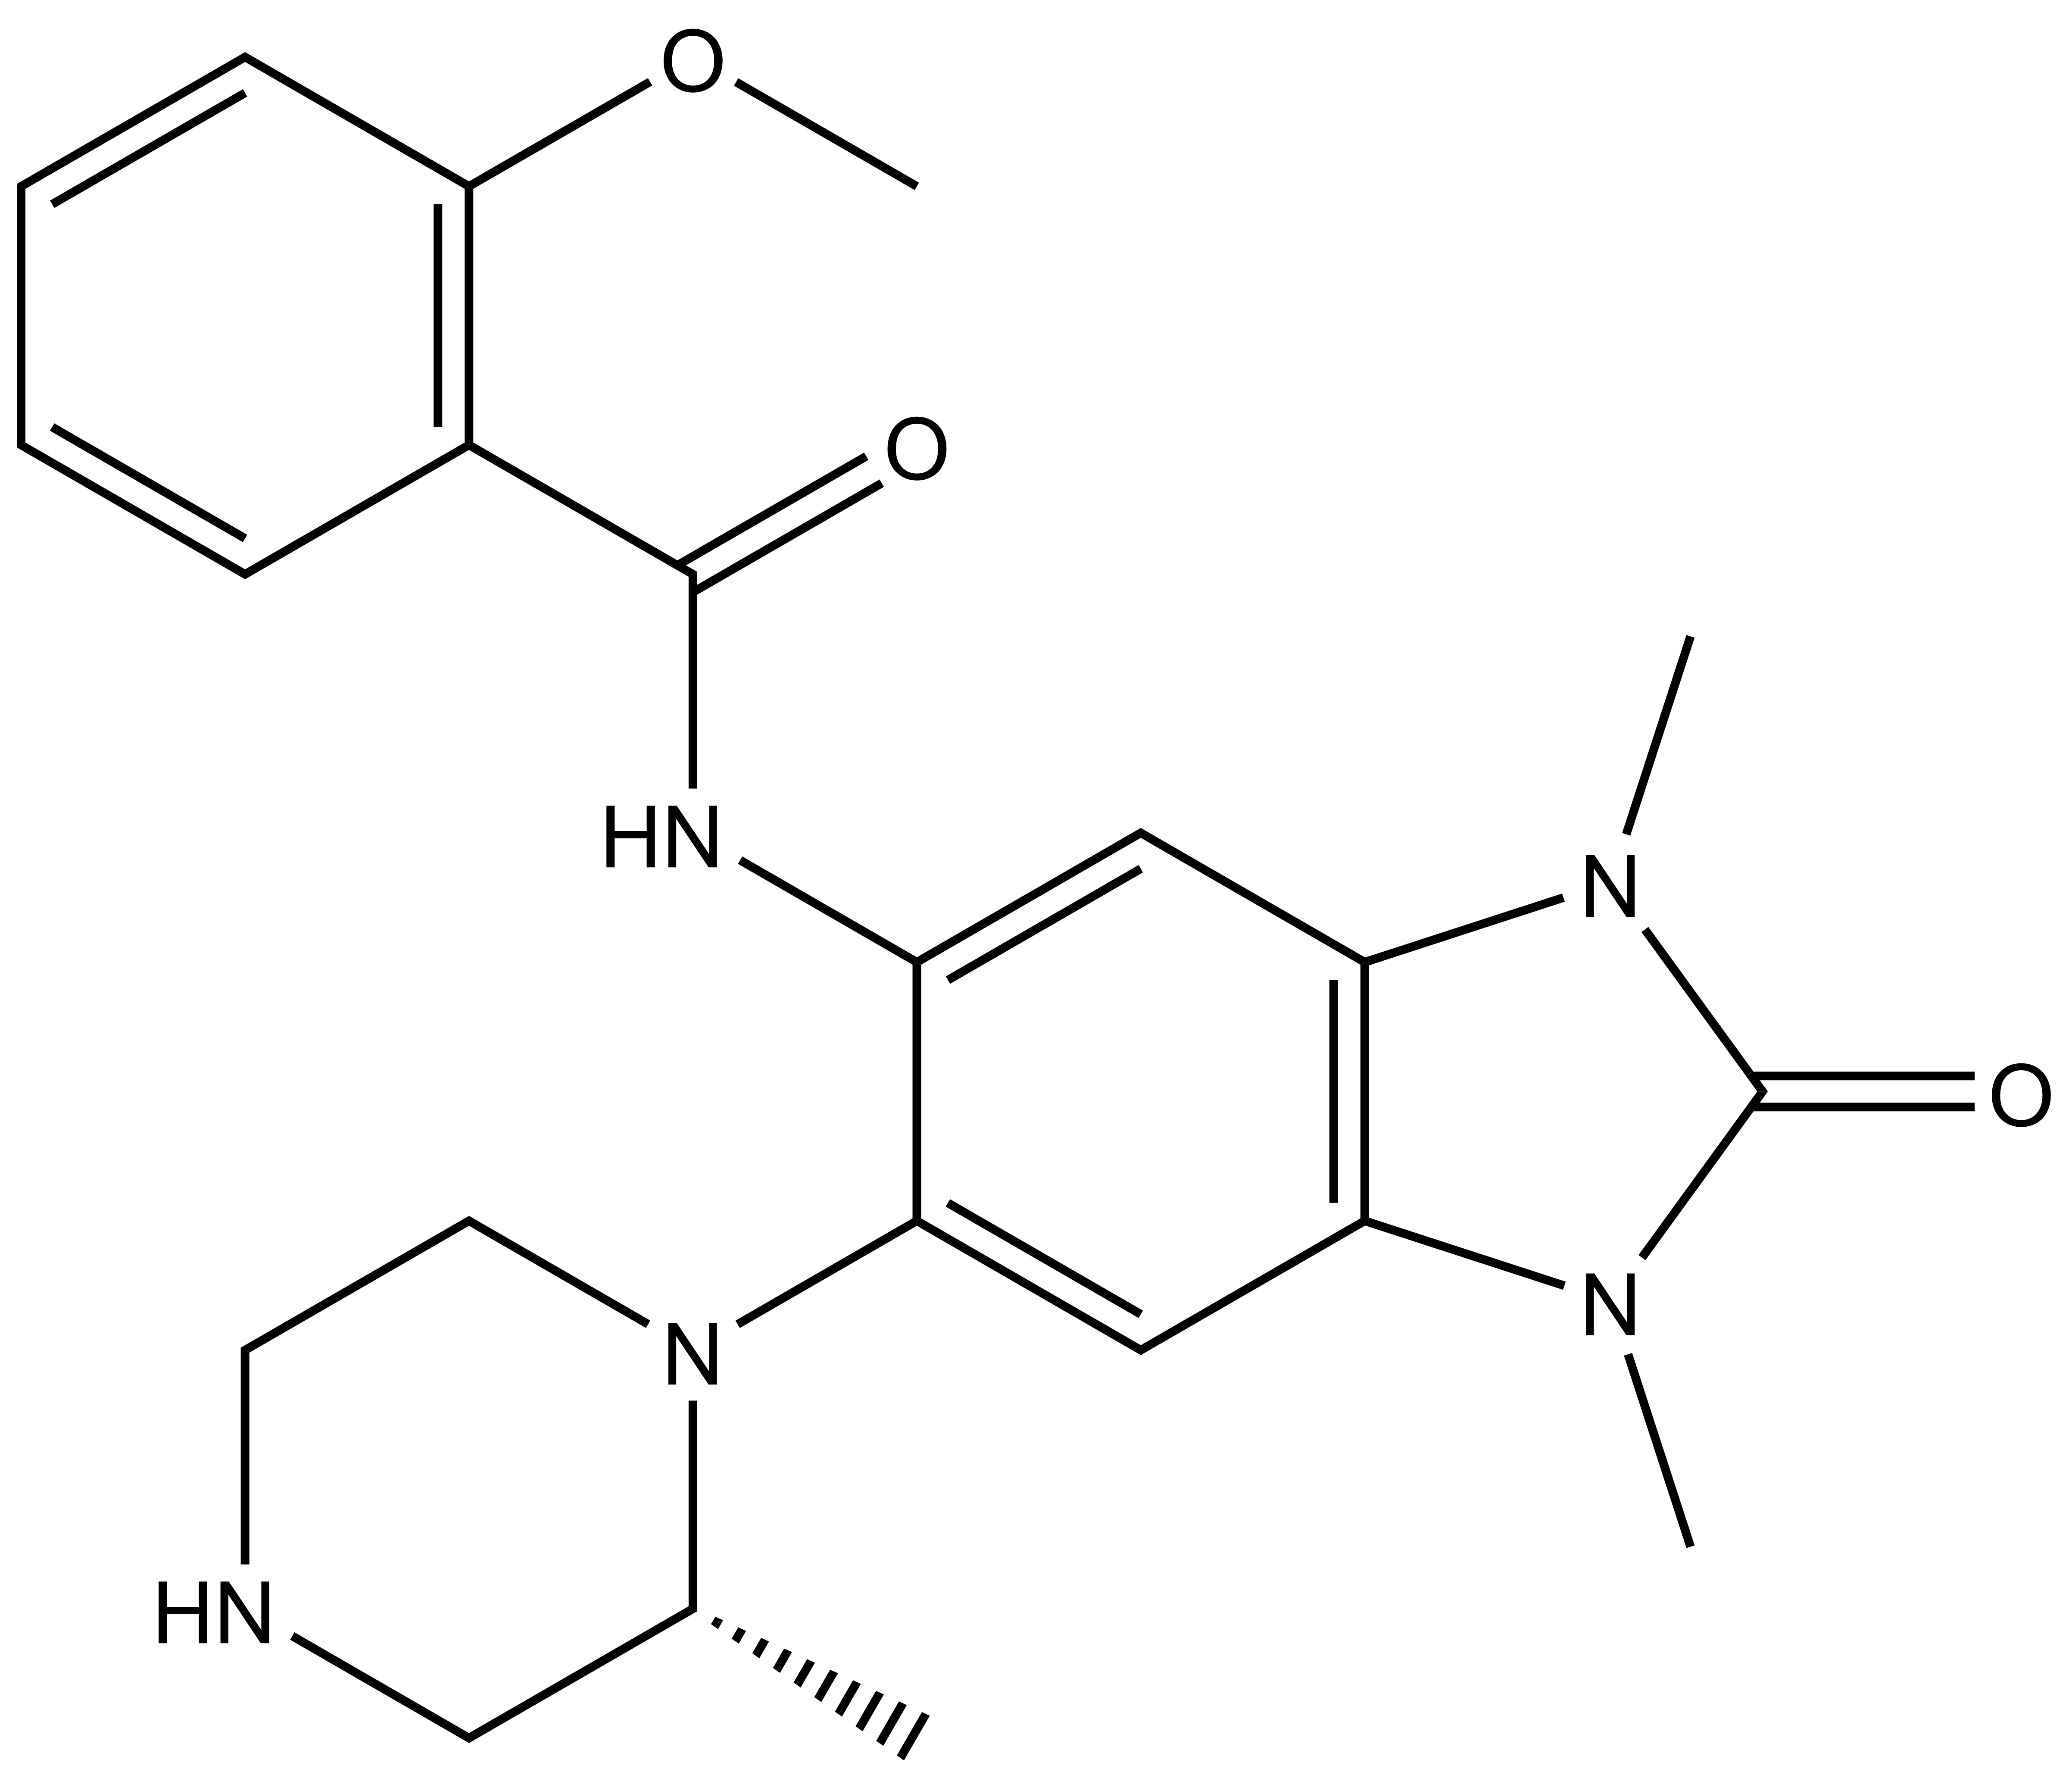
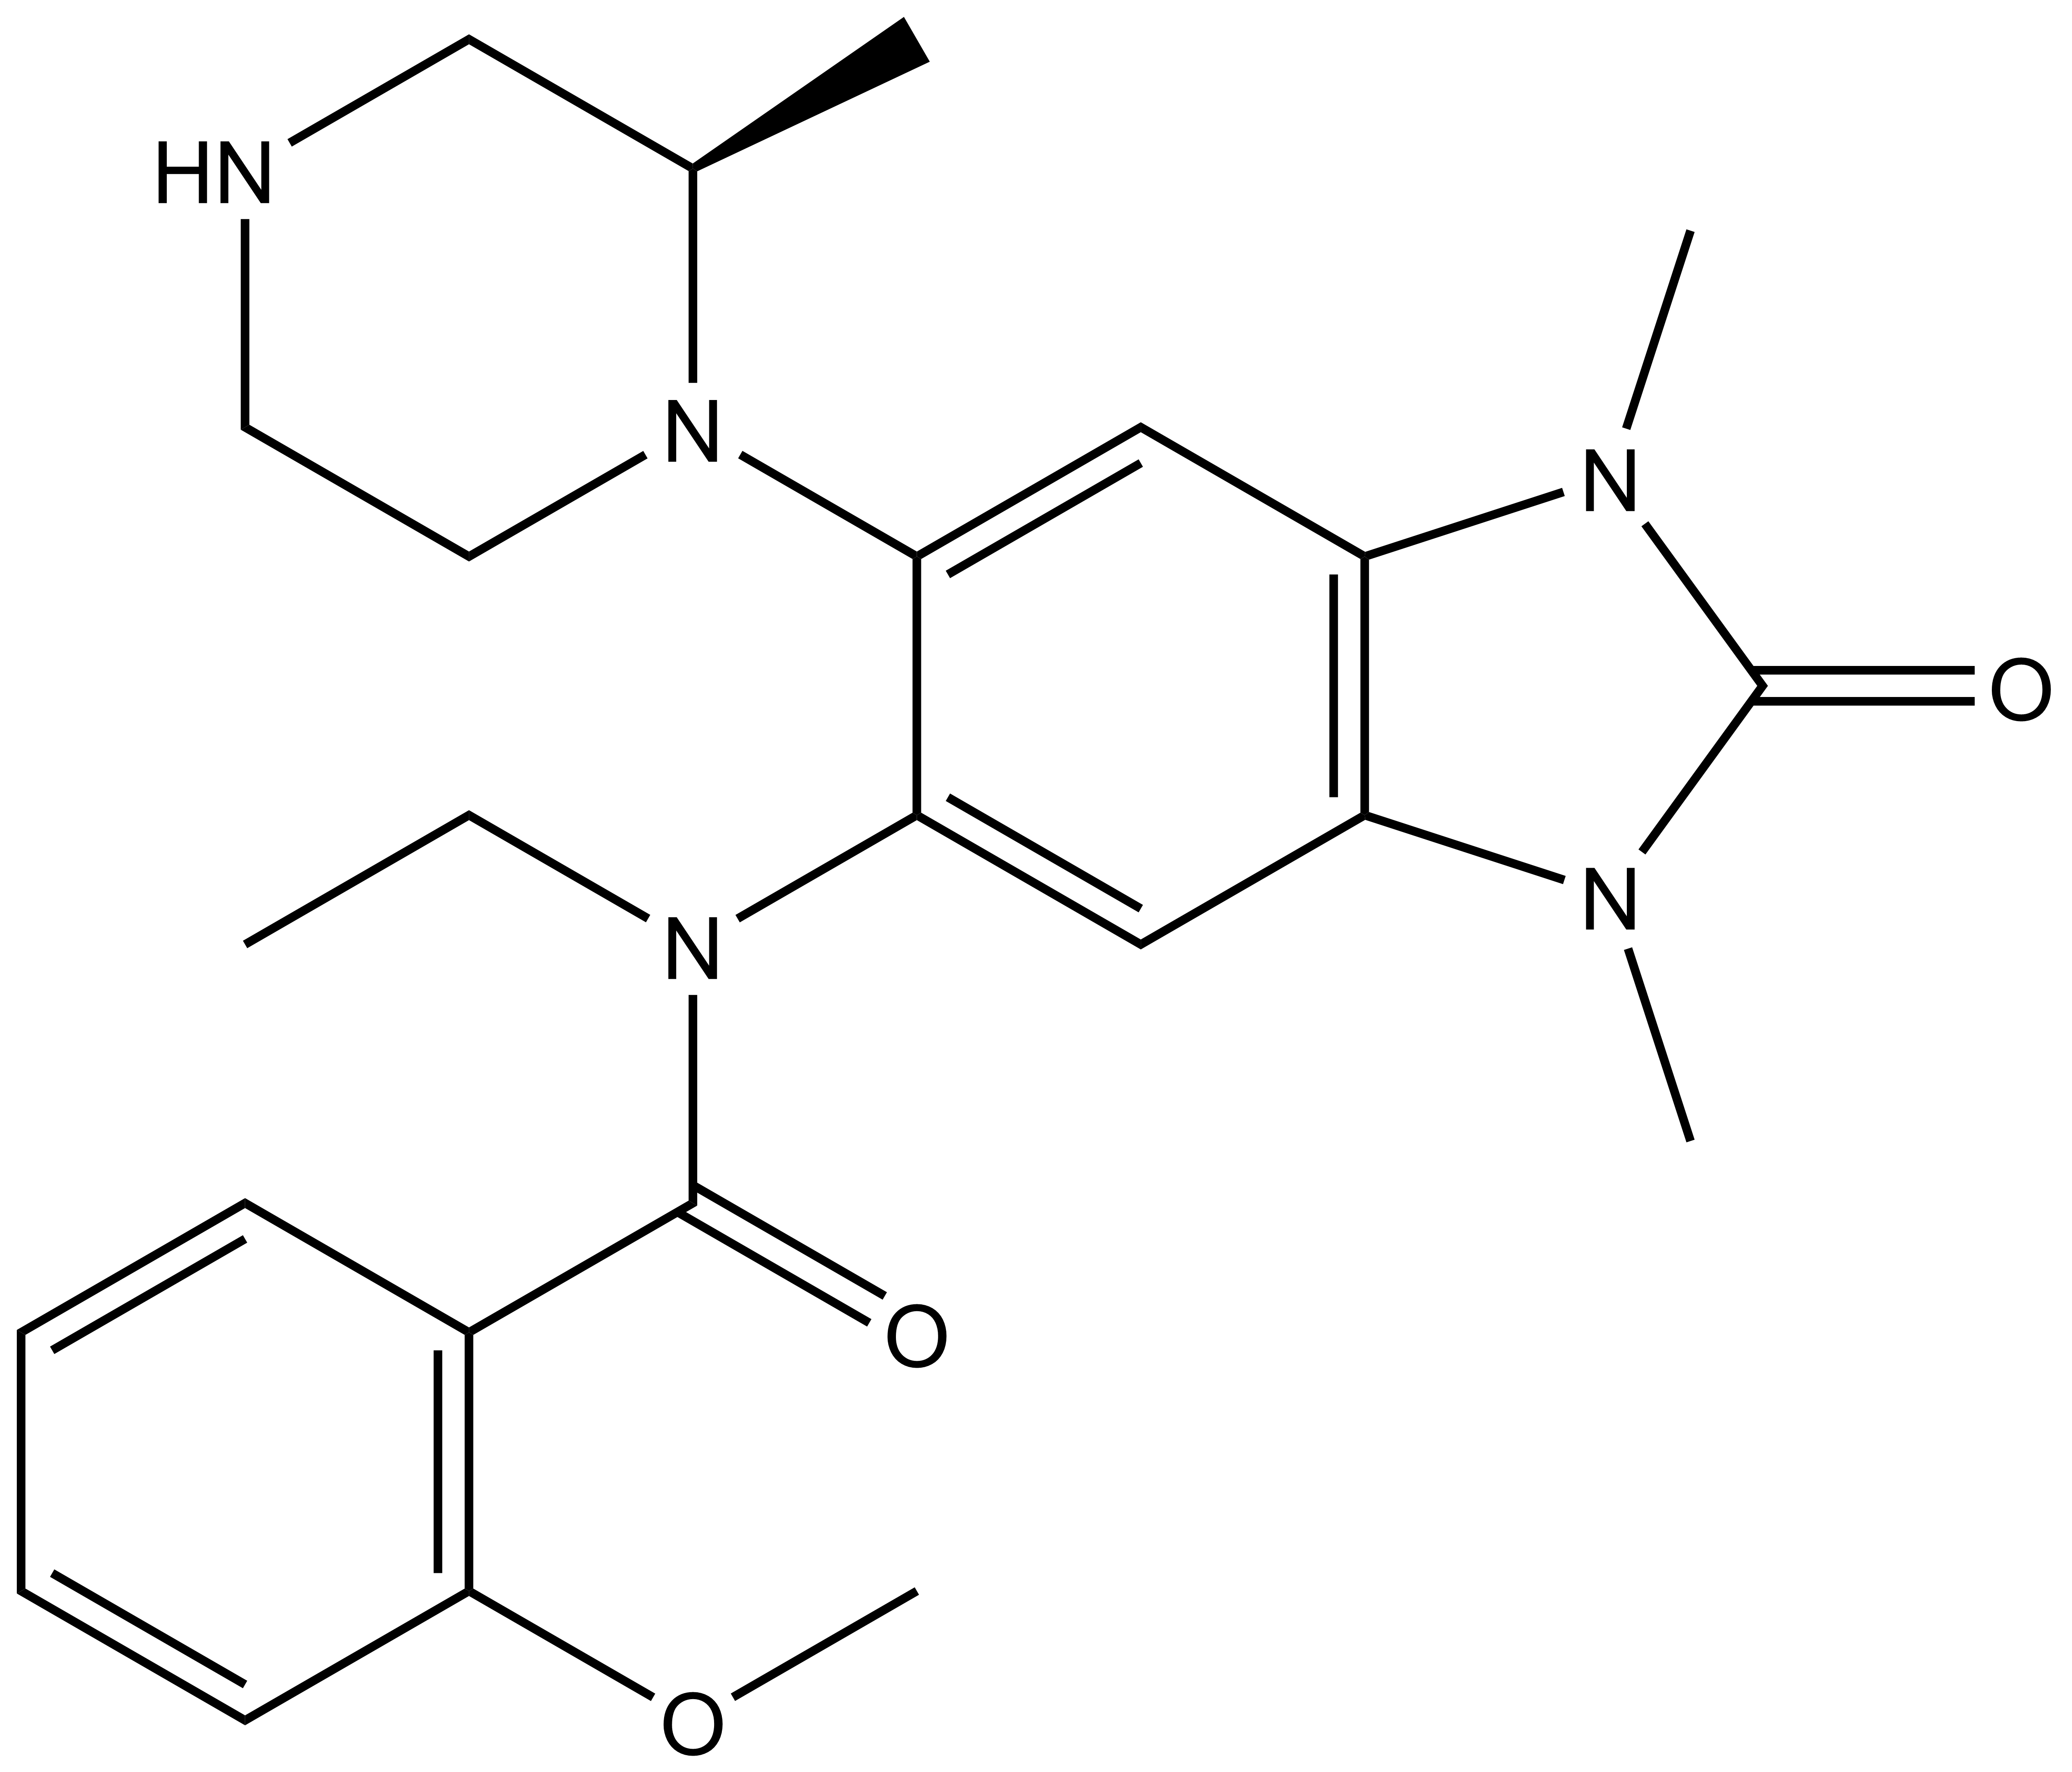
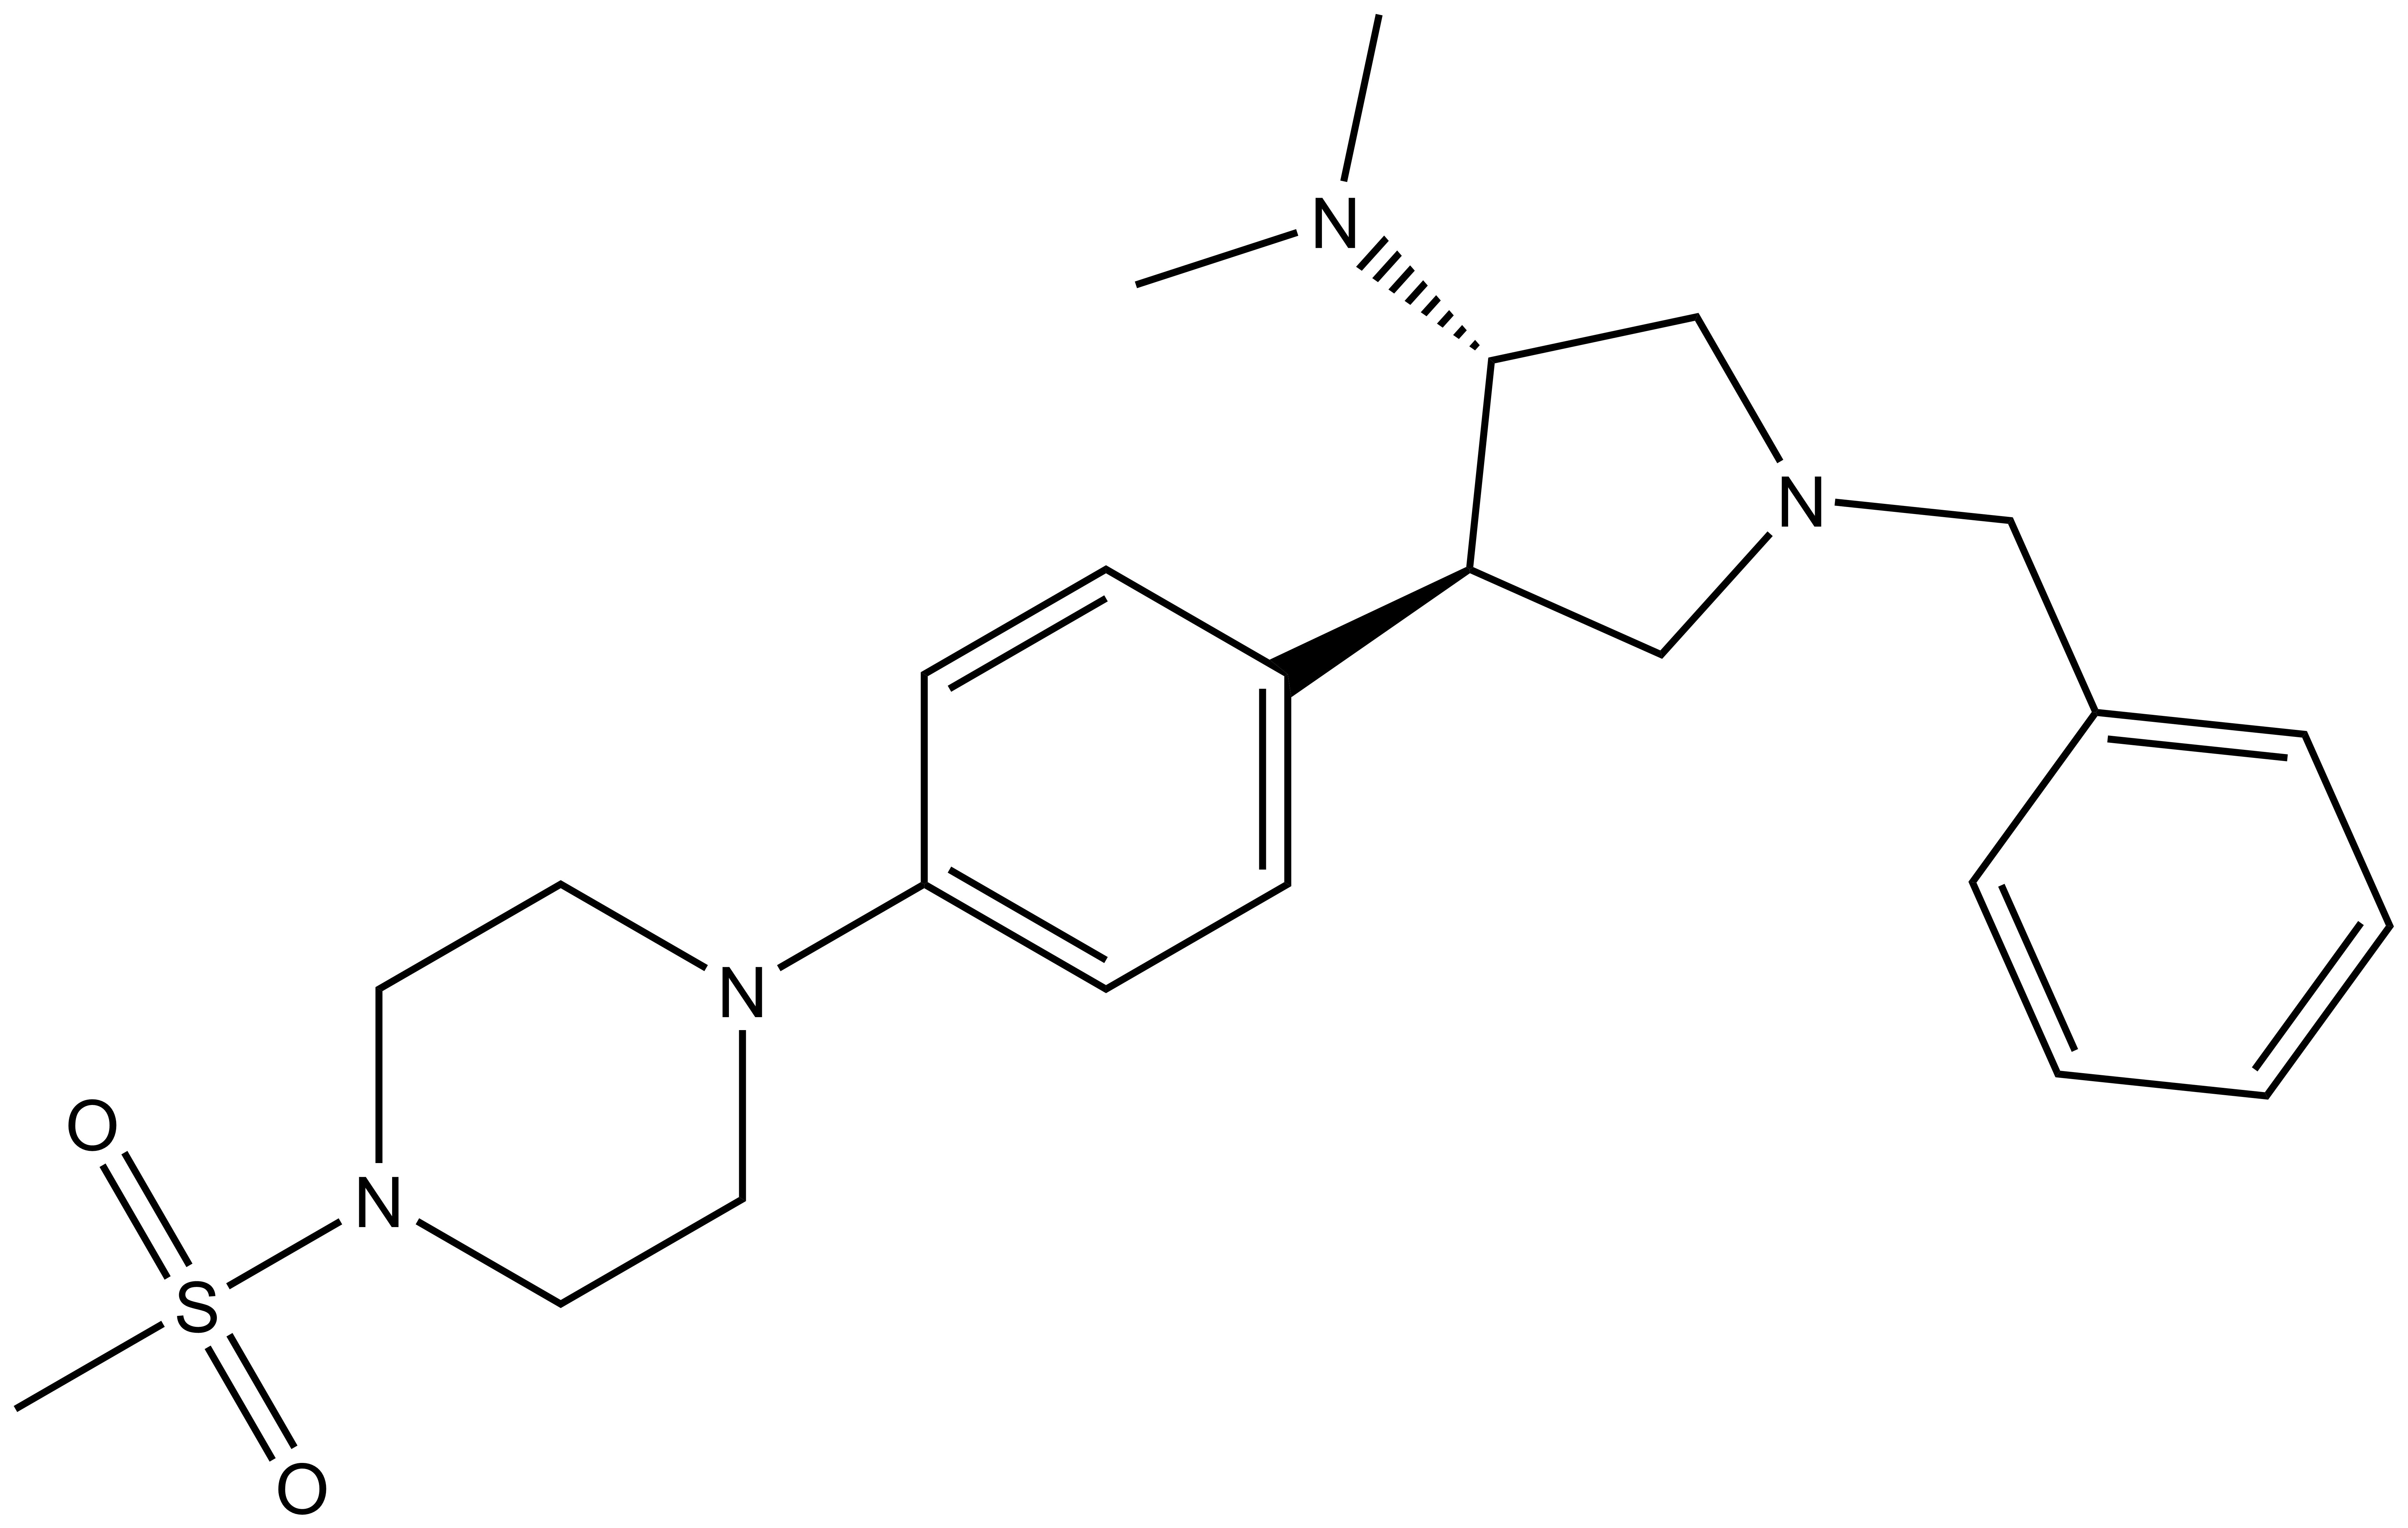
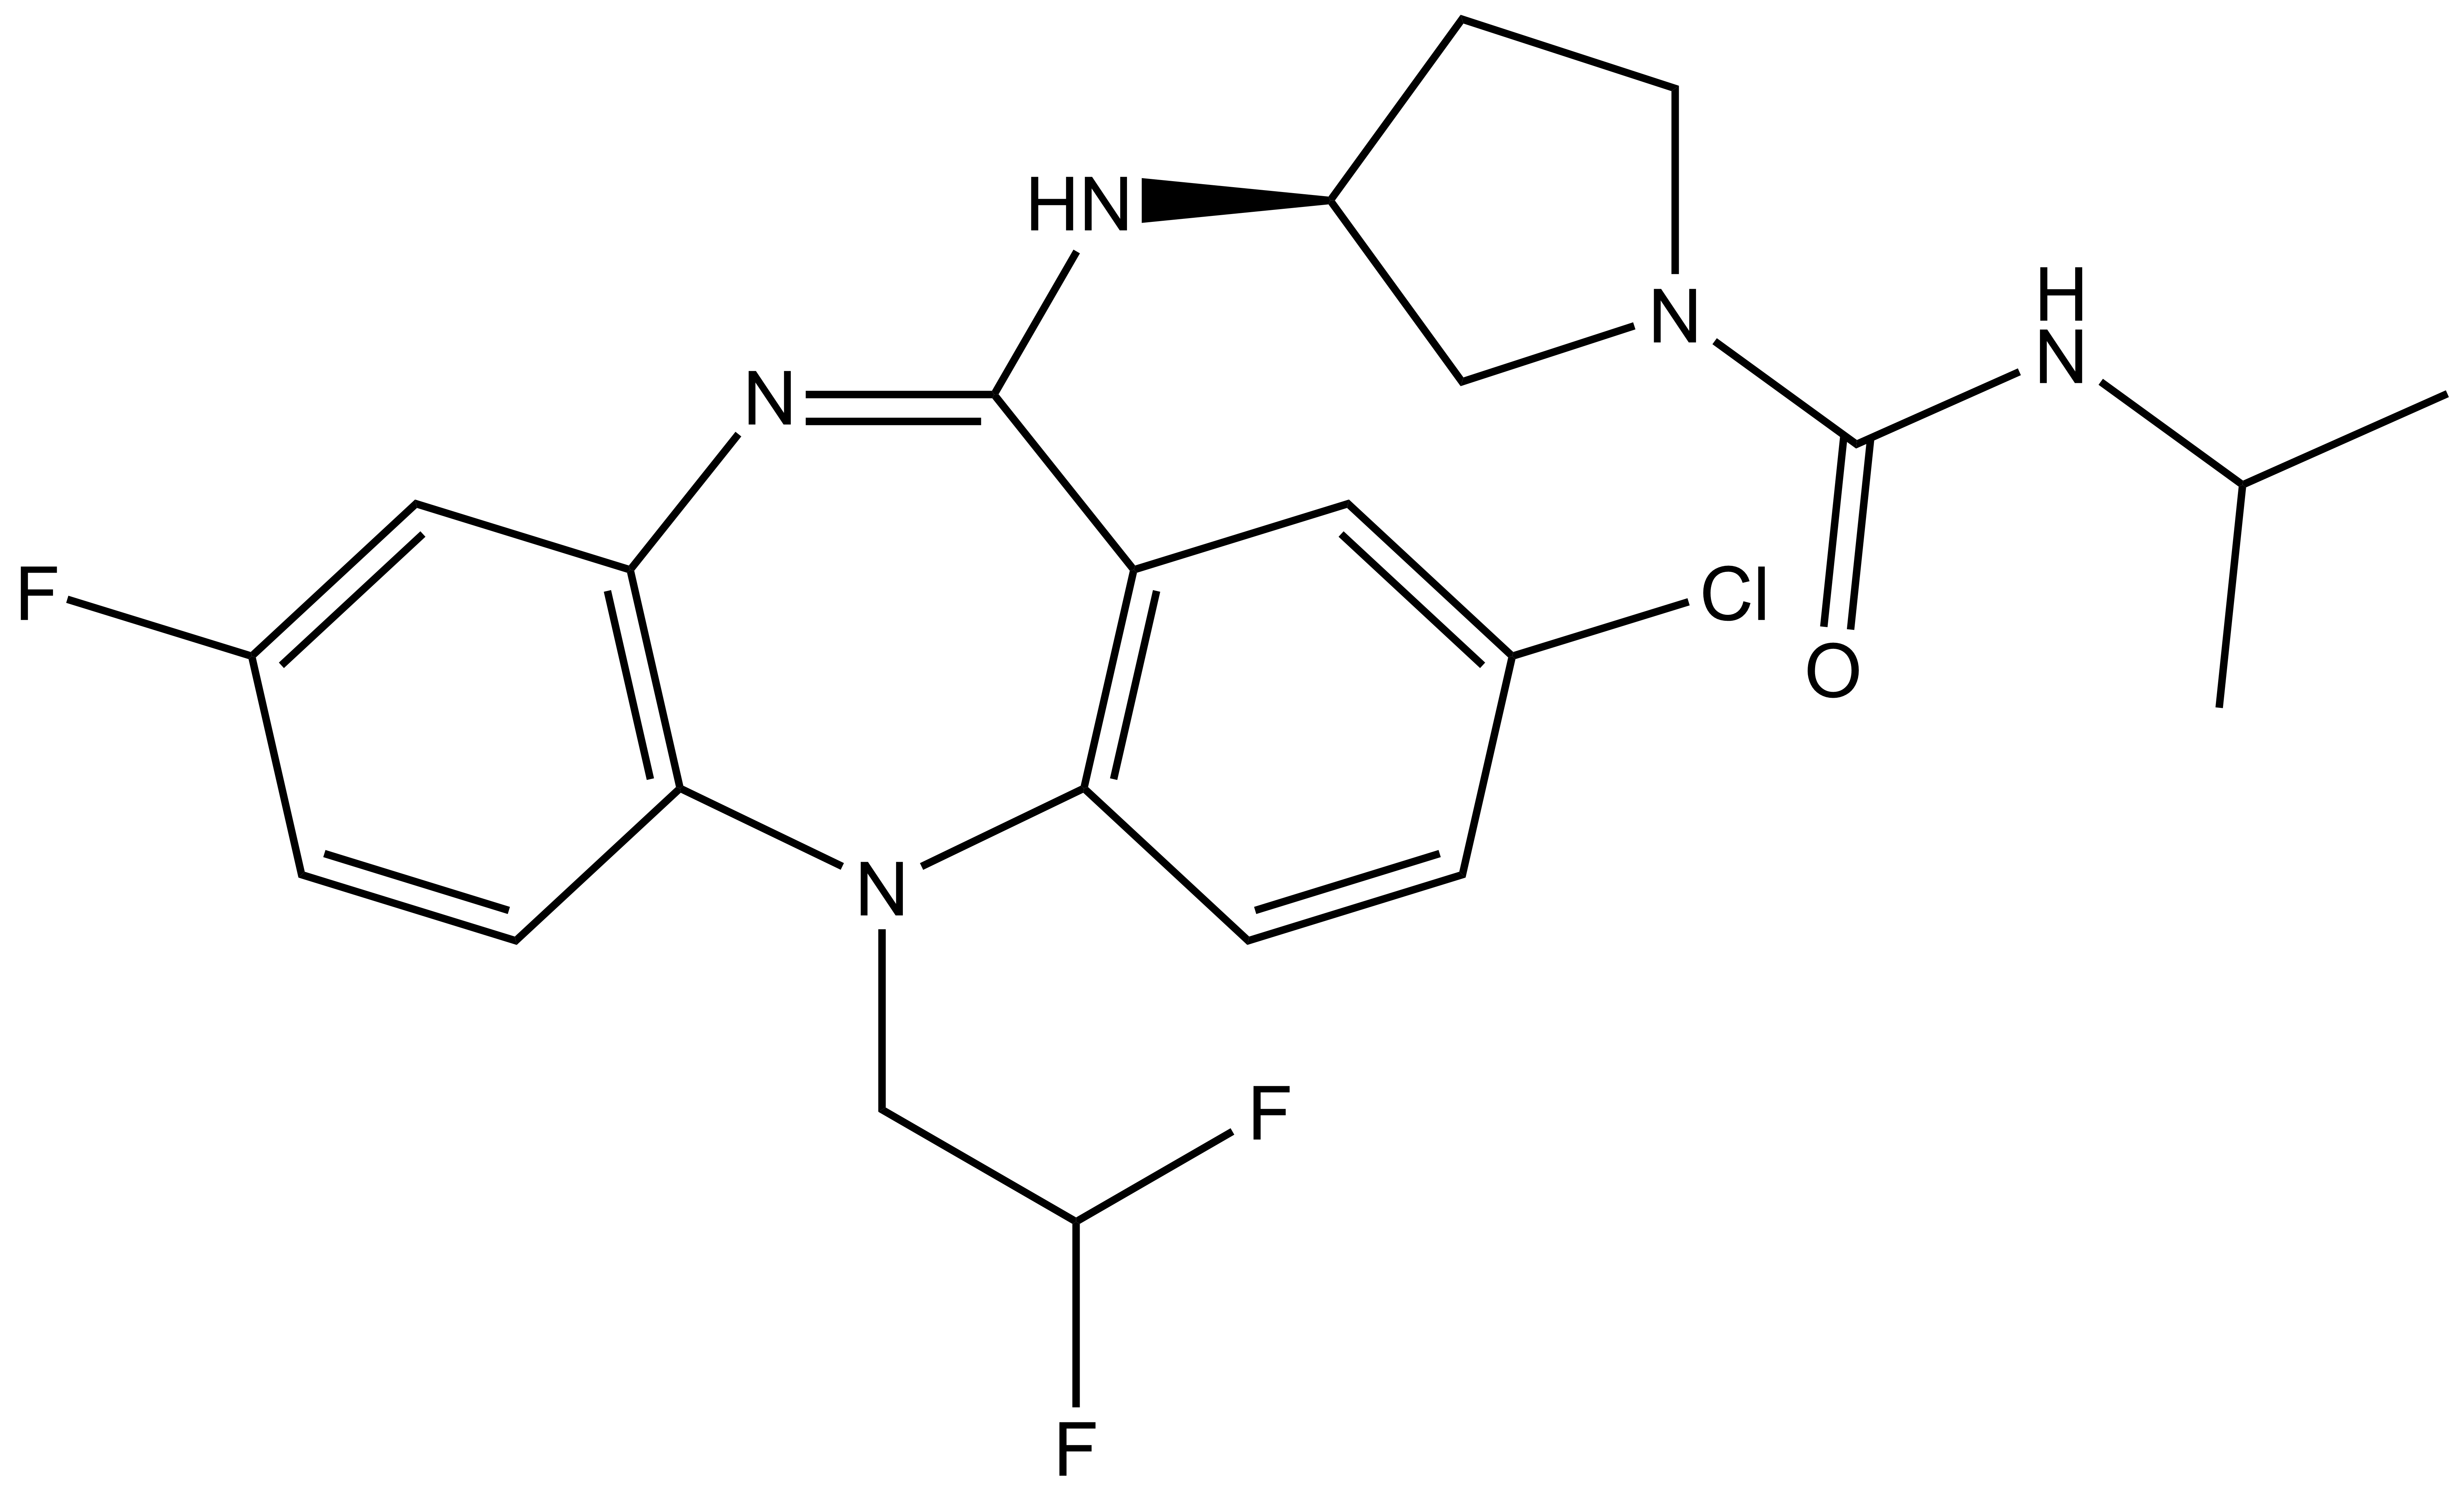
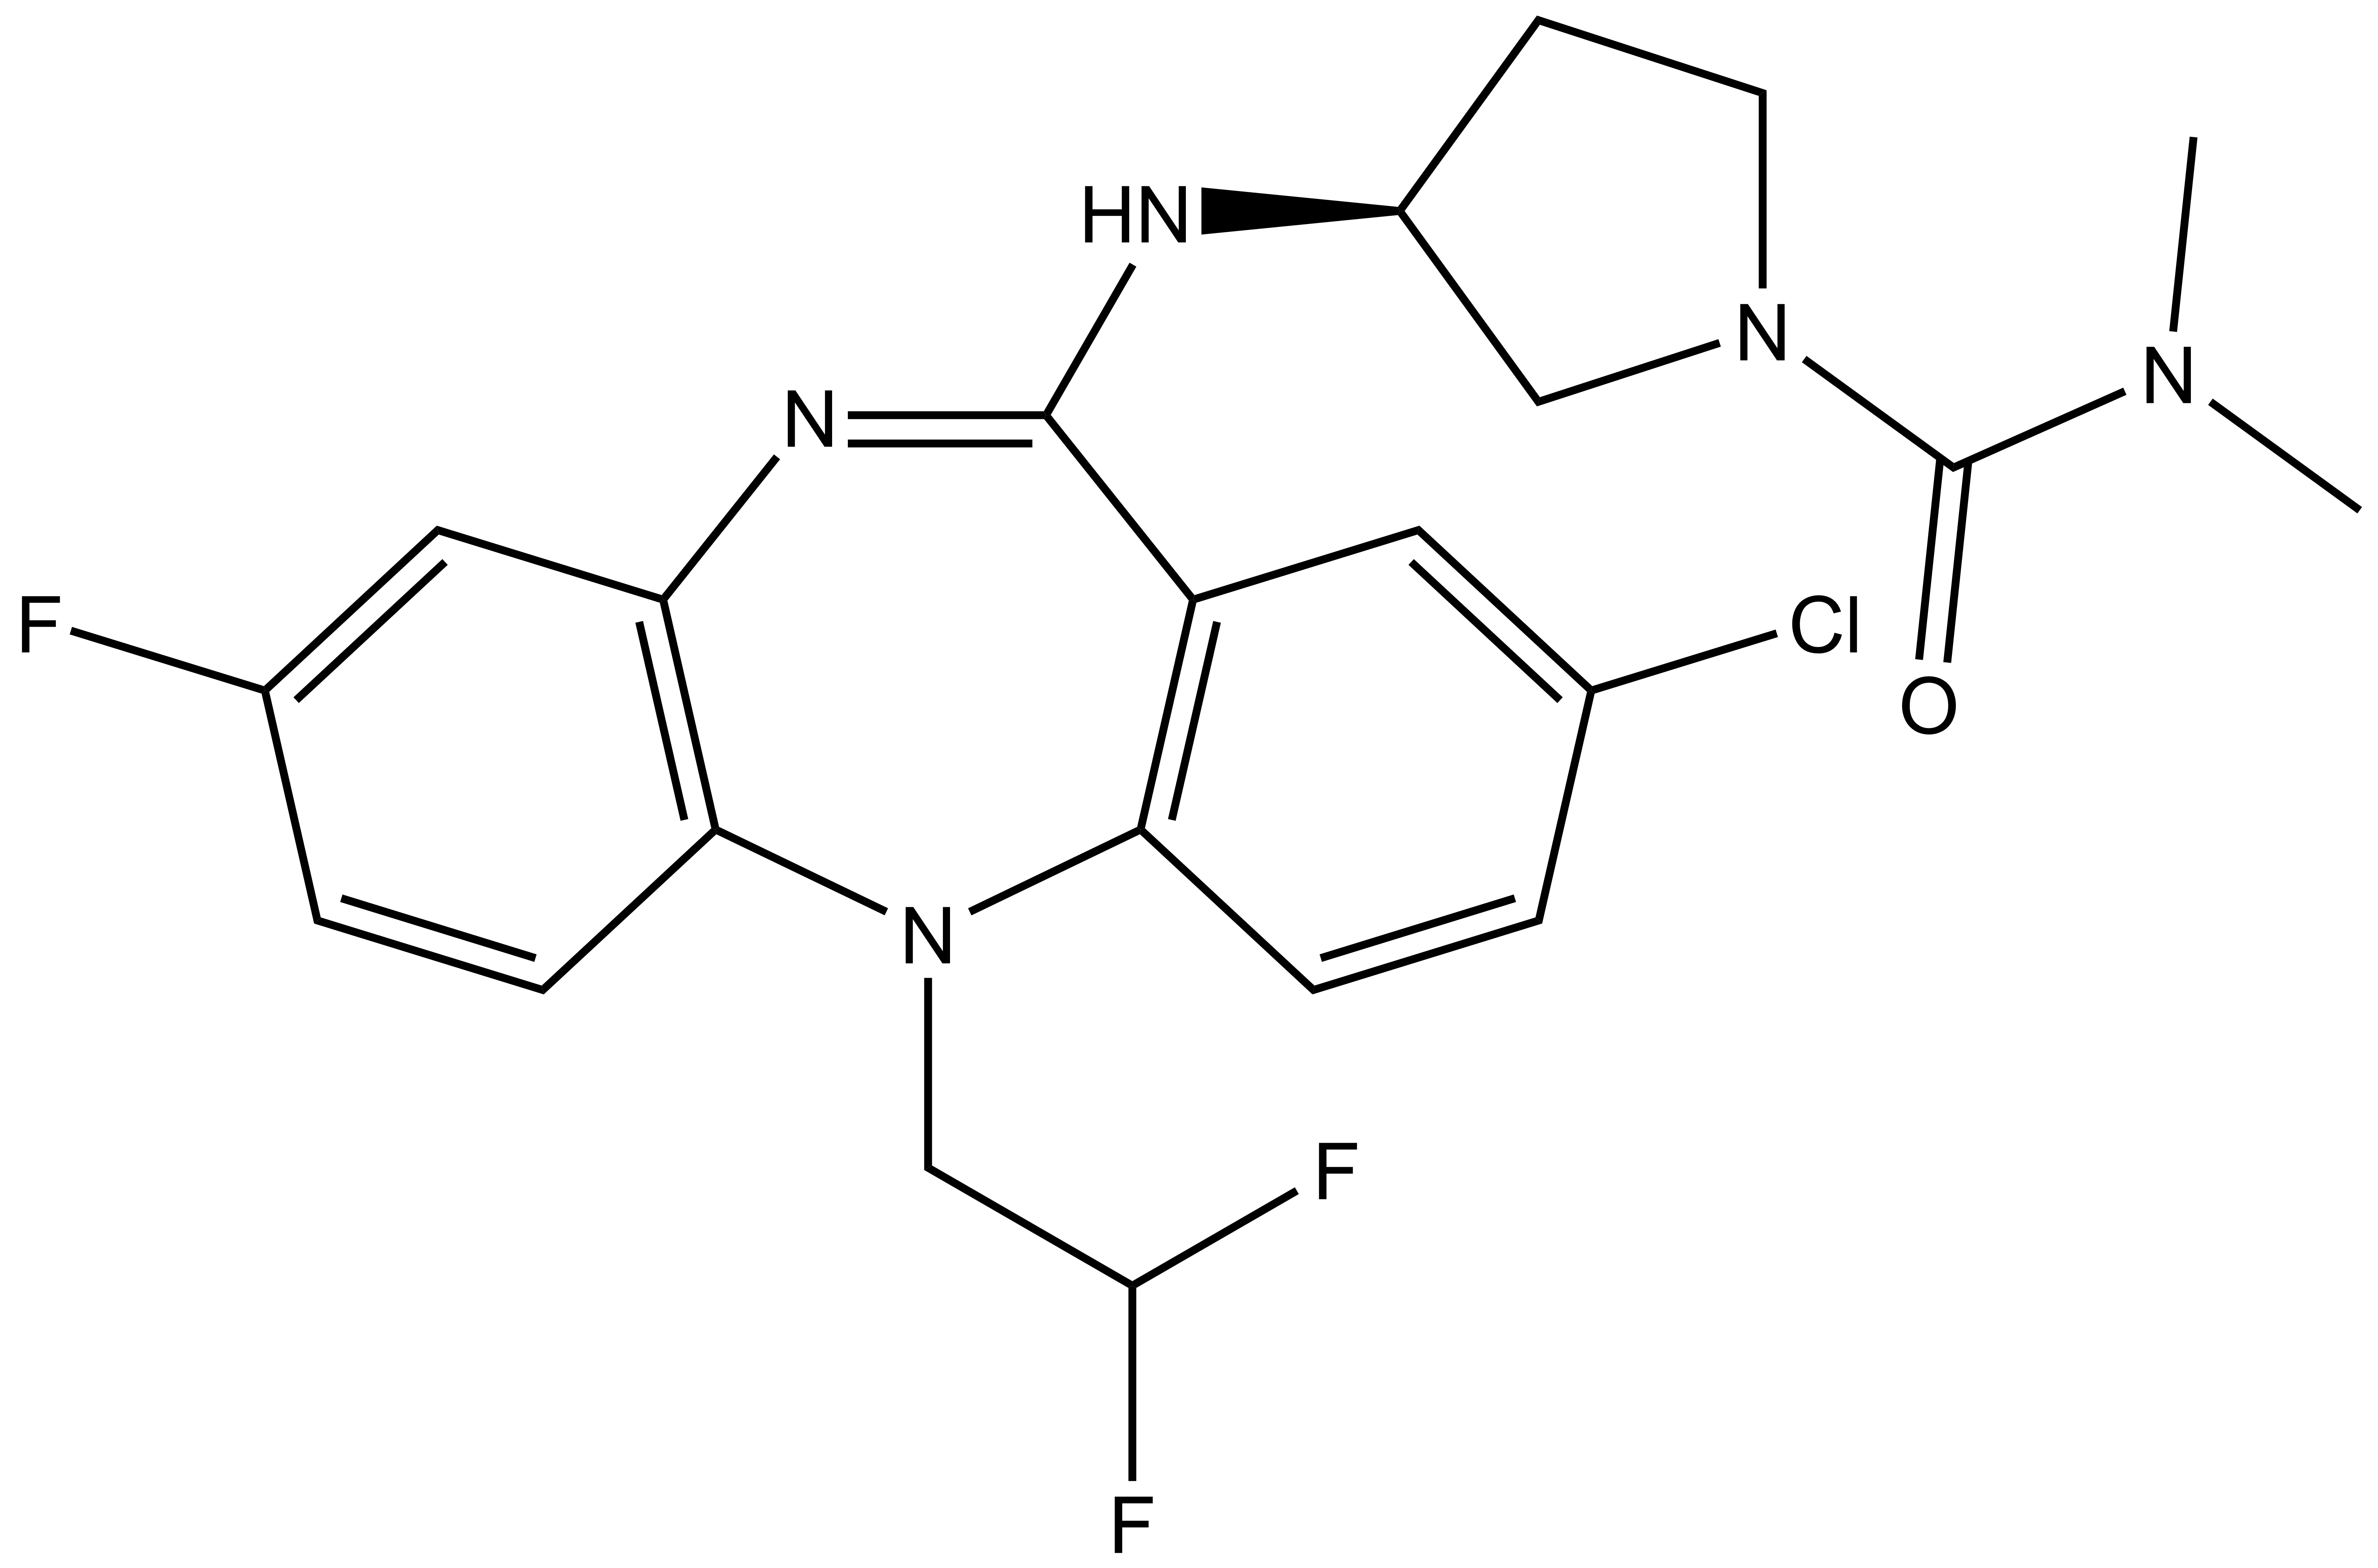
NVS-PAK1-1: A Chemical Probe for PAK1
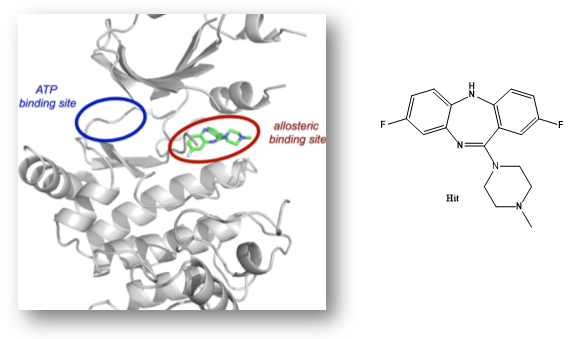
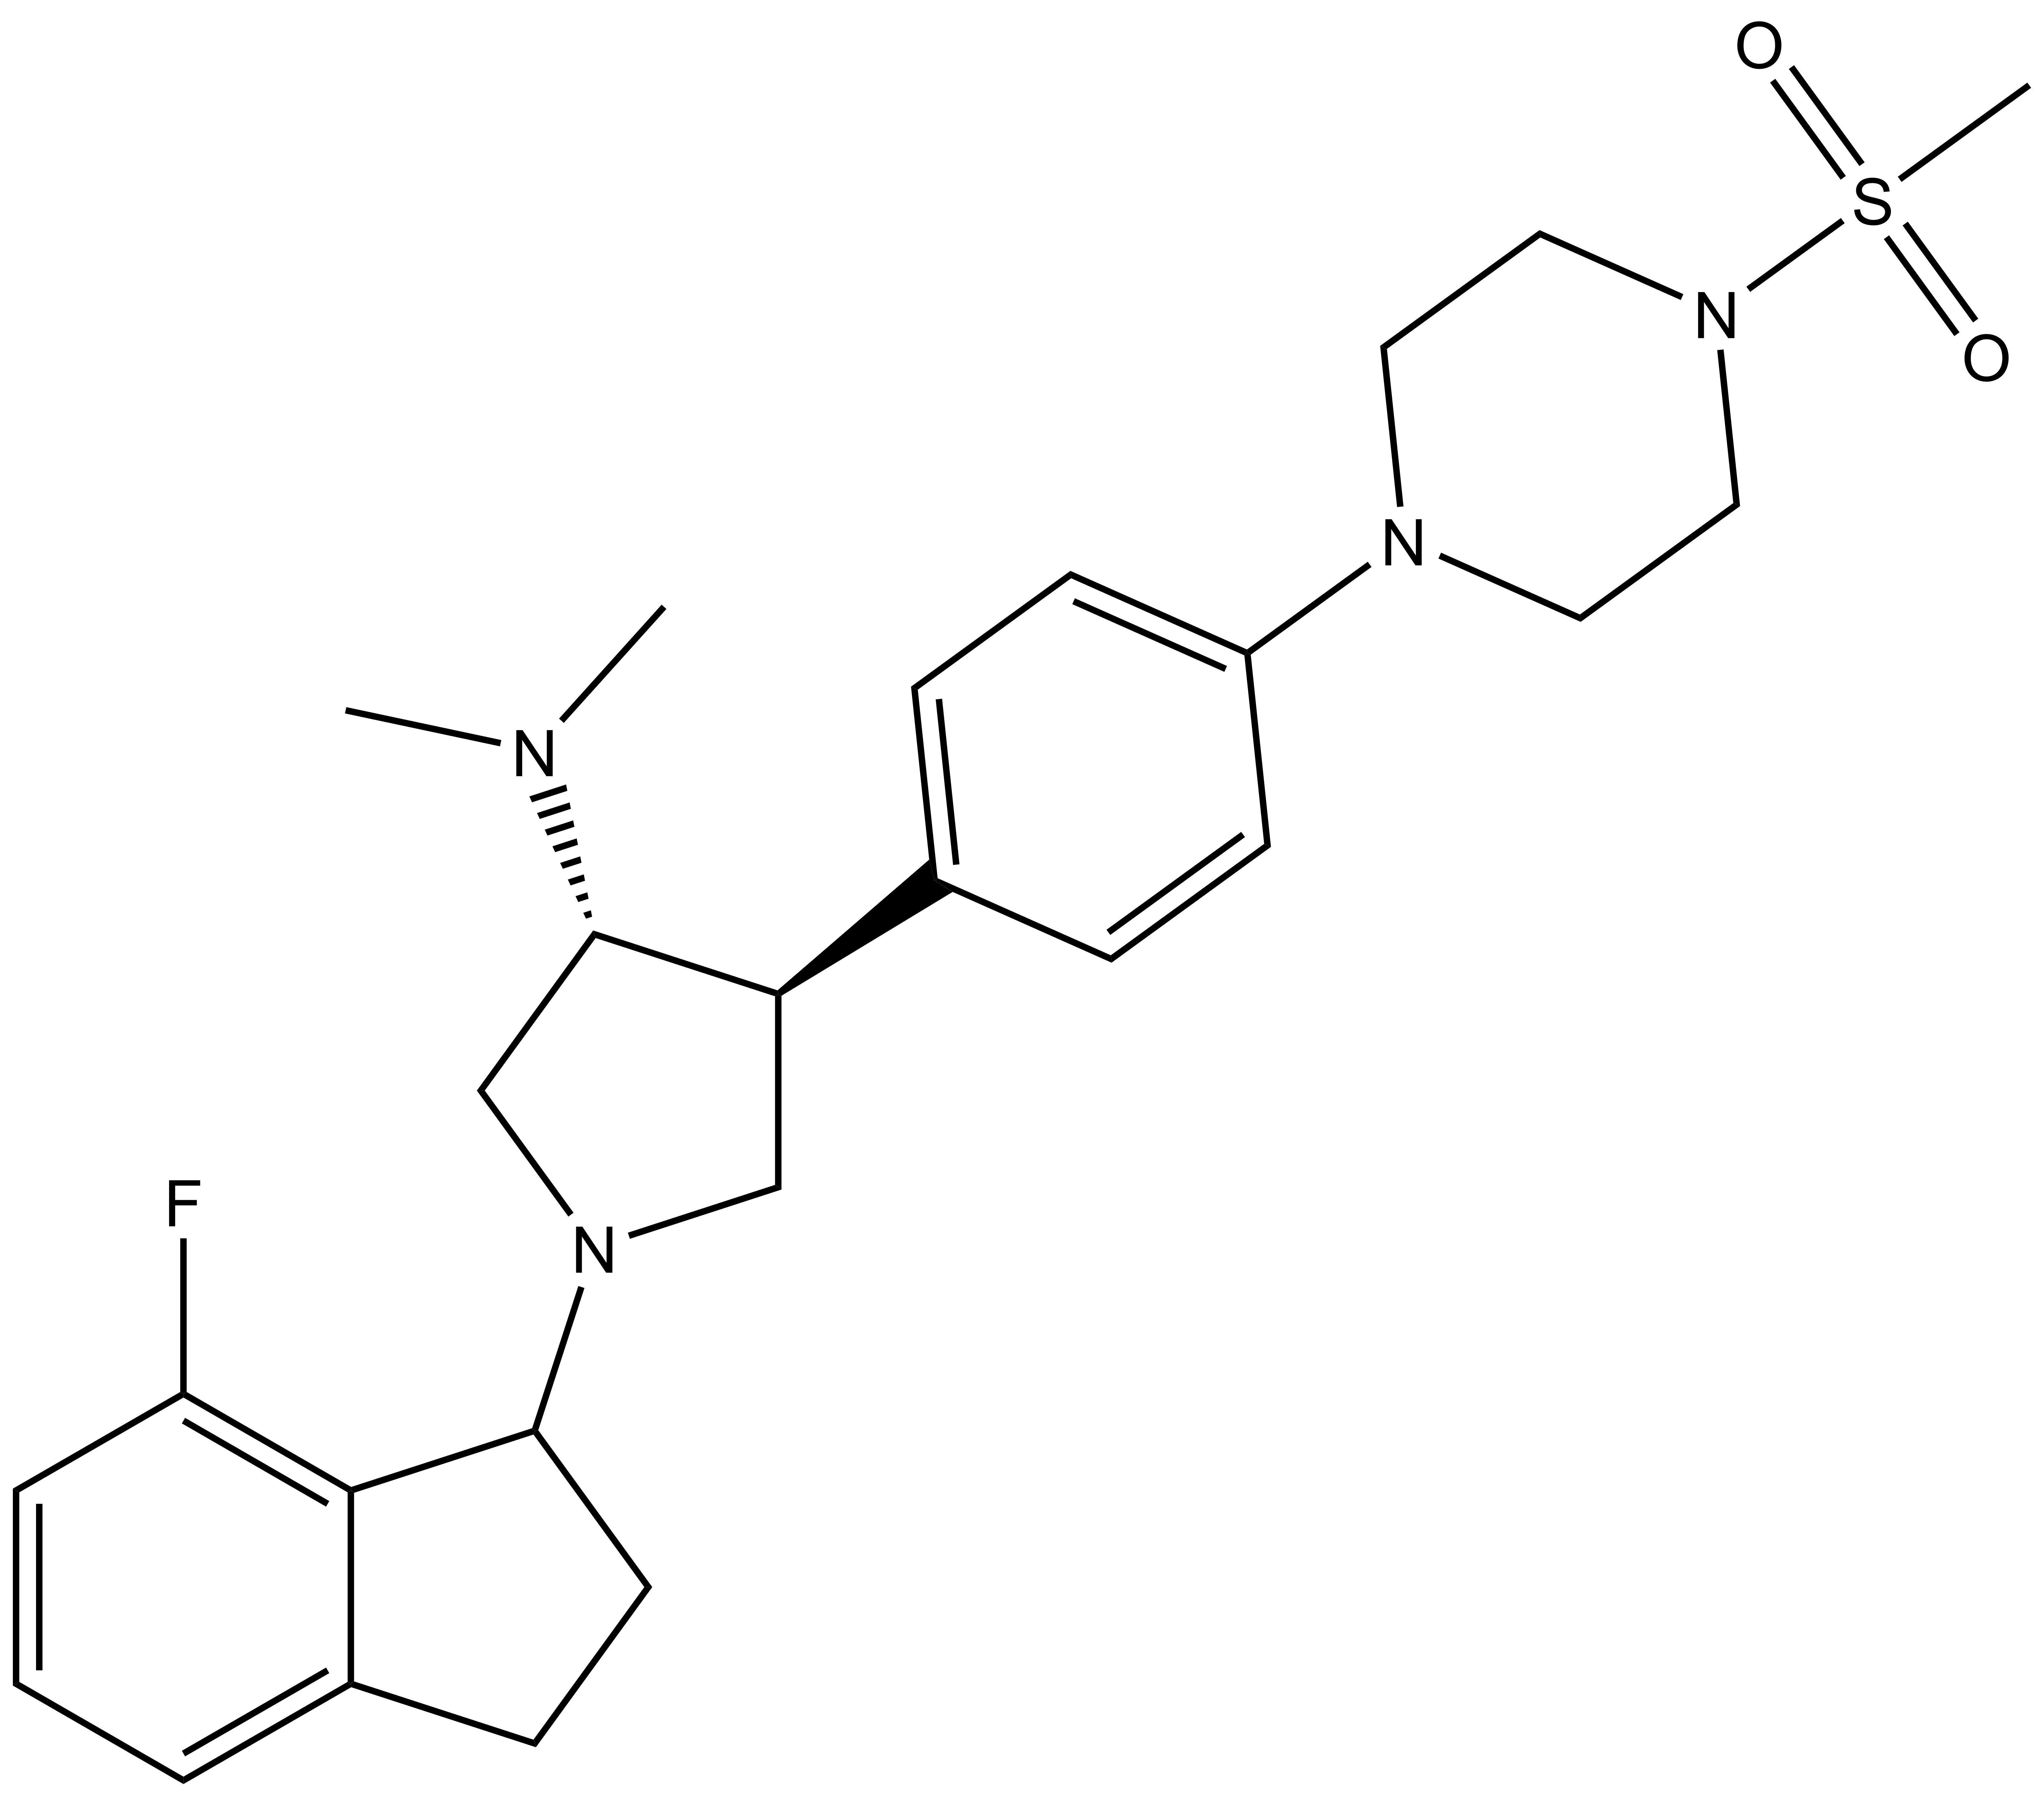
NVS1-PAK-1, a specific allosteric PAK1 inhibitor, has been developed by Novartis [1]
Chemical structure of NVS-PAK1-1 and its inactive control compound NVS-PAK1-C
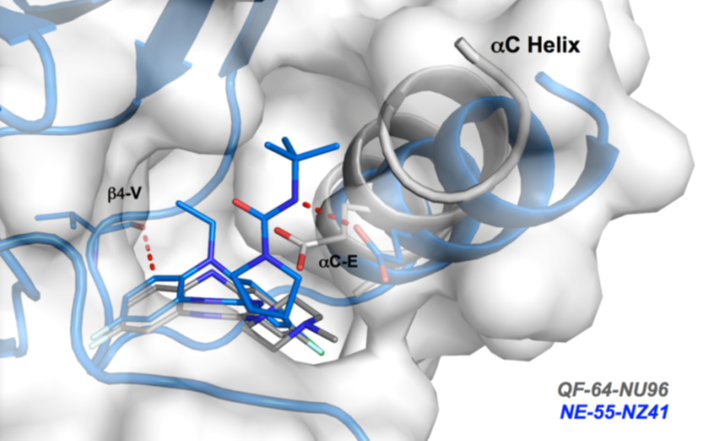
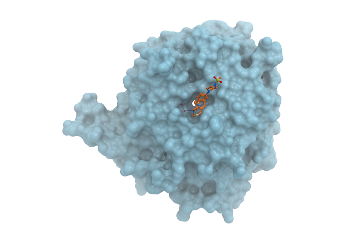
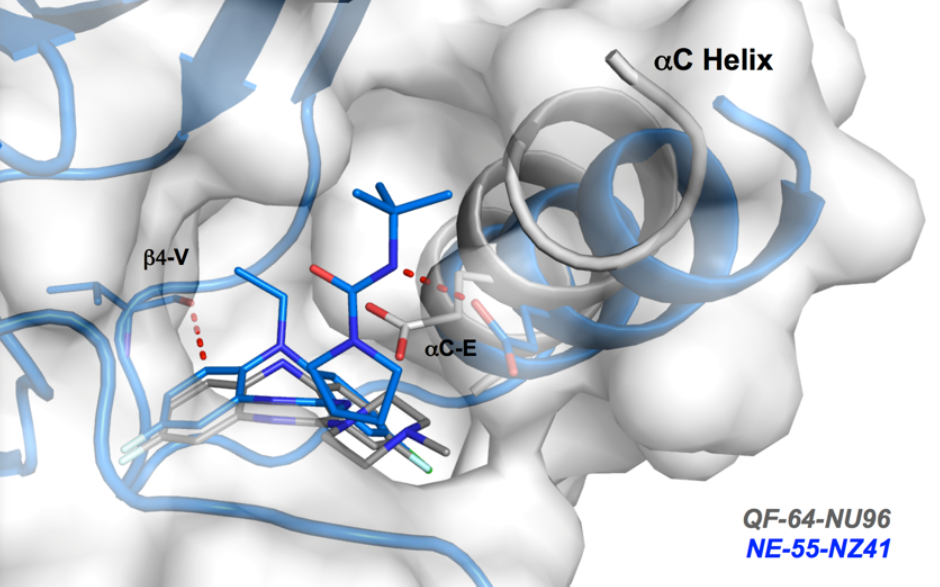
Co-Crystal Structure
Details of the co-crystal structure of the hit compound and a related compound with the PAK1 kinase domain, click on the 'Co-Crystal structures' tab above for more details
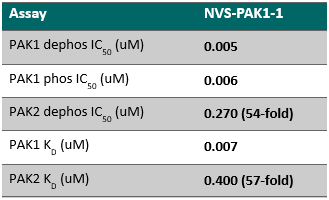
Potency Against Target Family
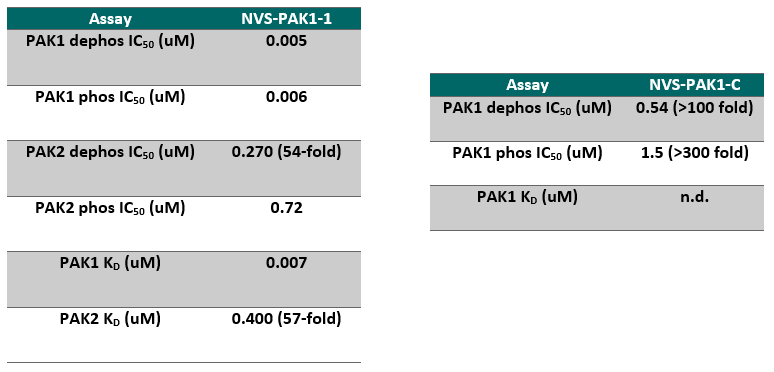
NVS-PAK1-1 is a potent allosteric inhibitor of PAK1 with an IC 50 of 5 nM for dephosphorylated PAK1 and 6 nM for phosphorylated PAK1 as assessed in a Caliper assay. This data is in good agreement with KD of 7 nM assessed in DiscoverX kinome scan. Inhibition is ATP-competitive, most likely due to indirect competition due to incompatibility of ATP binding with the DFG-out binding conformation of the allosteric compound. The control compound NVS-PAK1-C has more than 100 fold less activity in the respective Caliper assays.
IC Activity against the closest PAK member, PAK2 is over 54 fold. NVS-PAK1-1 has an IC50 of 270 nM against dephosphorylated PAK2 and 720 nM against phosphorylated PAK2 respectively in Caliper assay.
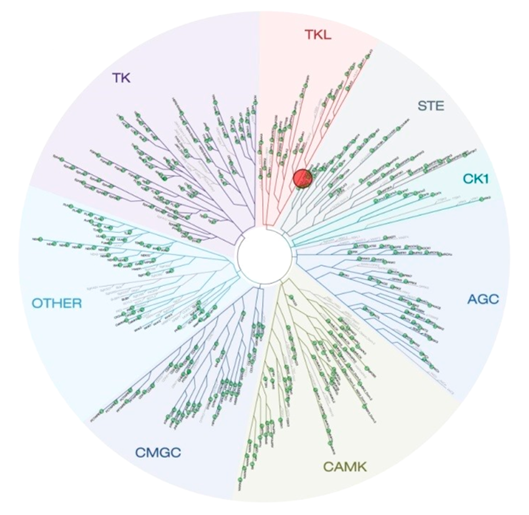
Selectivity
Selectivity of NVS-PAK1-1 was assessed against a panel of 442 kinases (DiscoverX kinome scan) at 10 µM and the compound was found to be exquisitely selective.
Selectivity Beyond Target Family
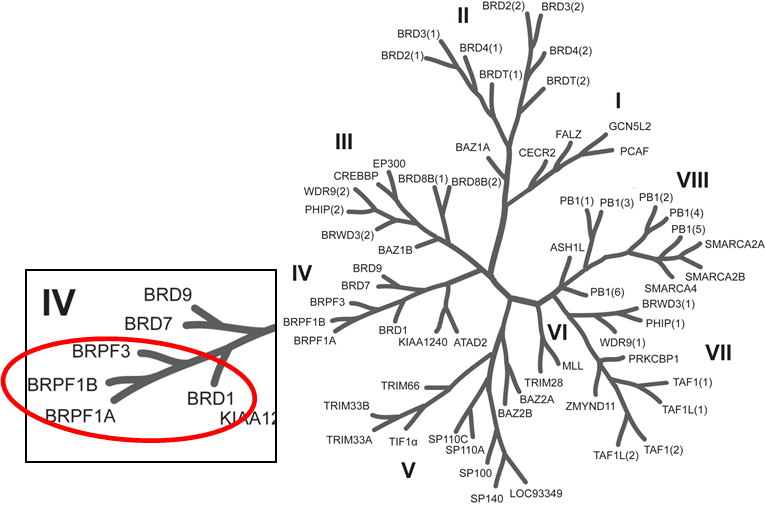
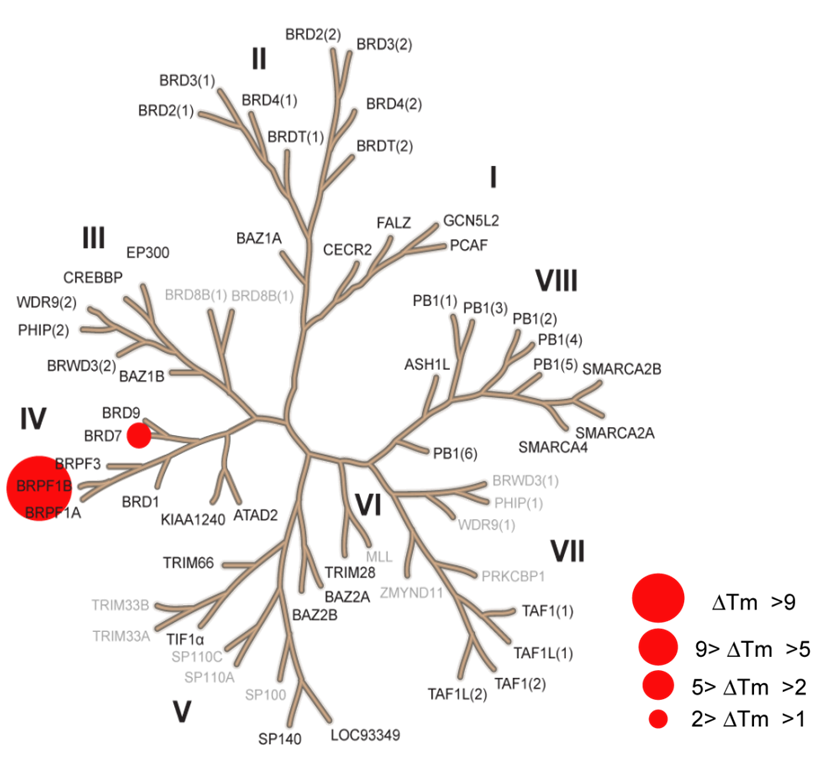
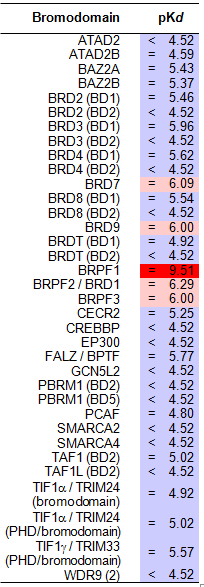
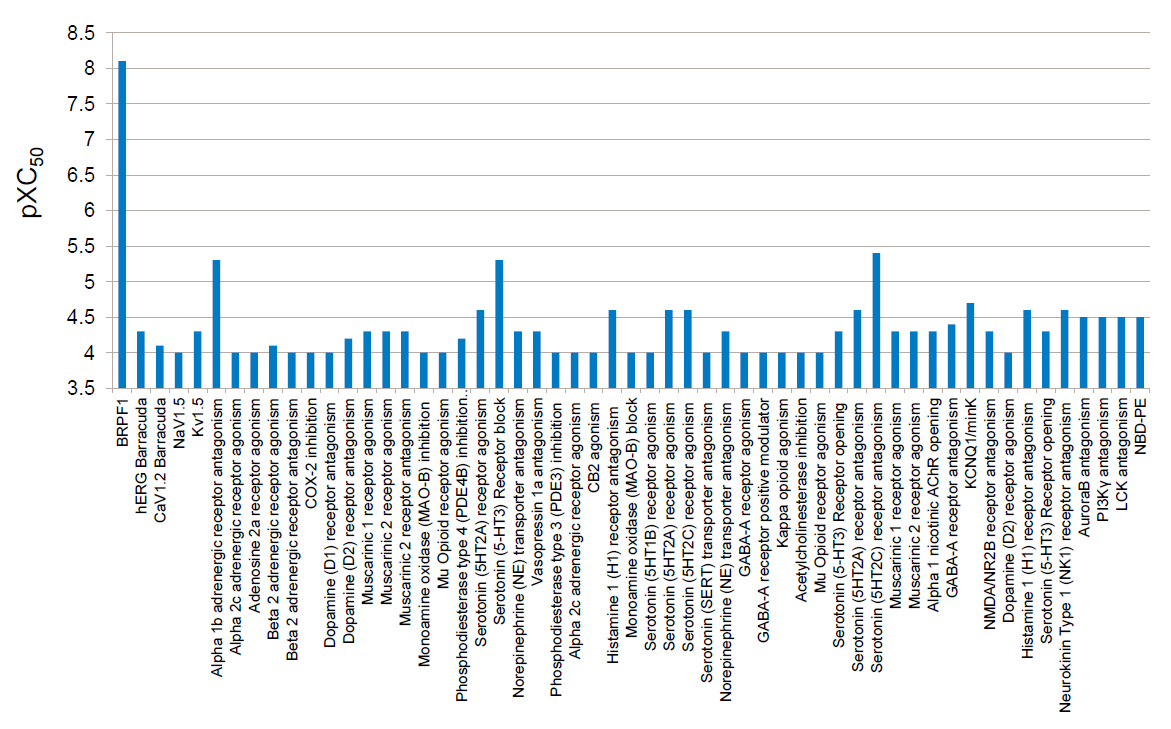
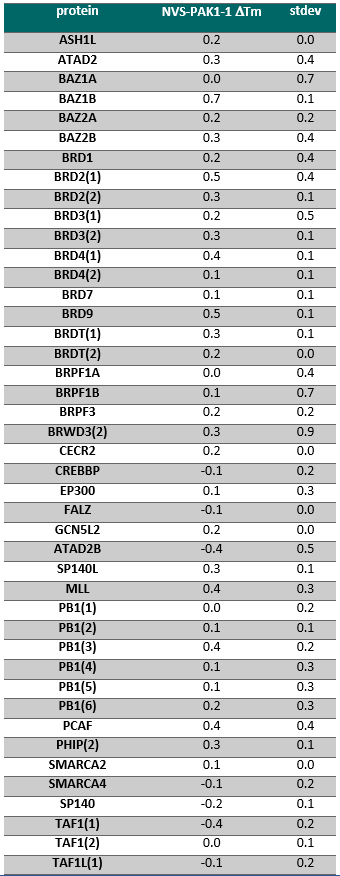
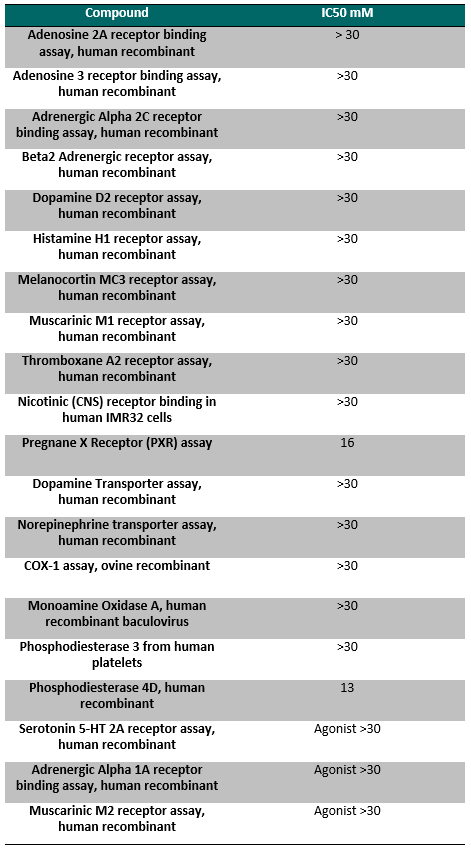
NVS-PAK1-1 was found to be inactive vs 27 receptors (Novartis panel) at 10µM, with the most potent activity measured of 13 uM against H1 and M1. No activity at 10µM was found in a panel of 48 BRDs.
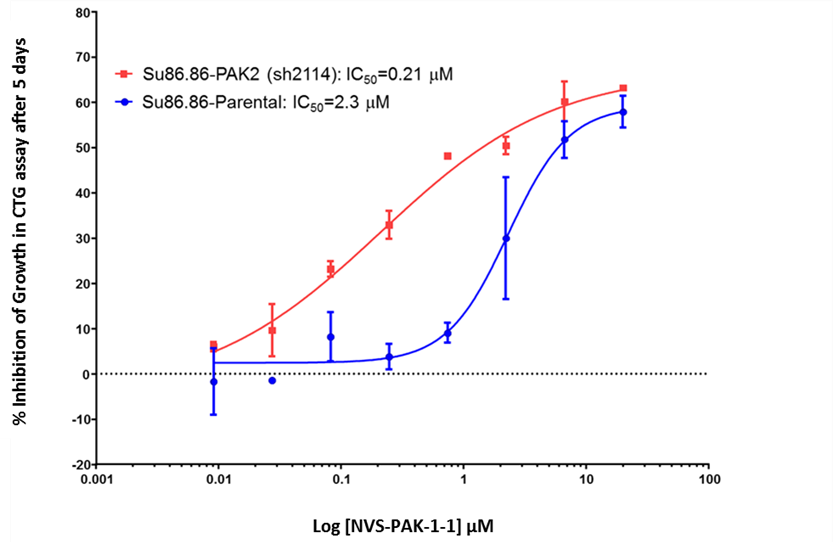
Cellular Activity
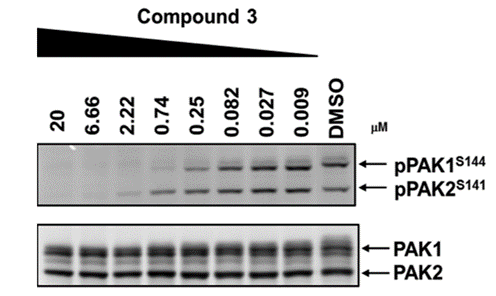
NVS-PAK1-1 potently inhibits autophosphorylation of PAK1 (S144) at 0.25 µM in the Su86.86 cell line and MEK S289 phosphorylation with an IC50 = 0.21 in Su86.86 cells in which PAK2 is downregulated.